Author address: The article was written when the author was at Vaccine and Infectious Disease Organization-International Vaccine Center (VIDO-InterVac), University of Saskatchewan, Saskatoon, Saskatchewan, Canada S7N2W8. personnel email: panky8 at yahoo dot com.
Virus isolation in cell cultures, immunofluorescence-based assay and molecular techniques to determine nucleic acid, have all been used successfully to detect and identify the viruses. On the other hand, the most commonly used methods to quantify viruses can be subdivided into three broader categories – techniques measuring viral infectivity (viral plaque assay, TCID50 and immunofluorescence foci assay), those that examine viral nucleic acid and protein (qPCR, immunoblotting, immunoprecipitation, ELISA and hemagglutination assay) and those that rely on direct counting of physical viral particles (viral flow cytometry and transmission electron microscopy). Since each of these established methods has several limitations (Table 1), improved techniques of virus identification and quantification, such as mass spectrometry [5], next-generation sequencing/metagenomics [6, 7], and CRISPR [8, 9], are explored to overcome their limitations. Here we discuss some of the most common virus identification and quantification protocols, currently being used both in experimental and diagnostic virology.
| Technique | Detection Principle | Reproducibility | Time | Labour | Cost |
|---|---|---|---|---|---|
| viral plaque assay | infectivity assay | poor | days | high | inexpensive |
| TCID50, LD50, EID50 | infectivity assay | poor | days | high | inexpensive |
| immunofluorescence foci assays | infectivity assay | poor | days | high | expensive |
| qPCR | viral nucleic acid | excellent | hours | moderate | expensive |
| immunoblotting | viral protein | good | days | moderate | inexpensive |
| immunoprecipitation | viral protein | good | days | moderate | inexpensive |
| ELISA | viral protein | good | hours | moderate | inexpensive |
| hemagglutination assay | viral protein | good | hours | moderate | inexpensive |
| viral flow cytometry | viral particle | excellent | hours | high | expensive |
| transmission electron microscopy | viral particle | excellent | weeks | high | expensive |
In 1954, J. F. Enders was first to propose the adoption of a cell culture-based system to classify animal viruses into four distinct categories consisting- viruses that caused cell degeneration, those that caused formation of inclusion bodies and cell degeneration, those that caused the formation of multinucleated cells (syncytia), and those that caused no cytopathic effect (CPE) [10]. Since then, cell cultures have been successfully tested routinely for in vitro isolation of viruses [11]. Presumptive identification of virus types can be made by observing morphological changes produced in host cells (CPE), caused by cytopathogenic viruses. Common damage to the host cells includes rounding of cells, a change in texture (granular or hyaline—glassy), and formation of a syncytium (fusion of infected cells). The extent of visible damage to cells caused by viral infection varies with strain, type of host cells, and multiplicity of infection (MOI); consequently CPEs becomes evident after as little as two days to as much as four weeks. Although most laboratories combine traditional and advanced laboratory approaches to optimize viral diagnostics, virus isolation from cell cultures still remains a primary method, particularly when viable and nonviable virus need to be differentiated, if a viable virus has to be isolated, and when infection is not characteristic of any single virus [11]. Traditionally cell culture-based virus isolation has been regarded as “gold standard” for the detection and diagnosis of viruses, and it is the technique to which all other test methods have been compared with [12]. High-throughput and/or high speed microscopy has also been developed to identify and/or isolate viruses. For example, Francis R et al devised a high-throughput microscope for real-time monitoring of amebas infected with giant viruses and a new tabletop scanning electron microscope for high-speed identification of those viruses from amoebal co-culture with environmental viral samples [13].
Although clinical specimen’s collection and processing protocols to isolate viruses may vary widely among different laboratories, some general recommendations for sample collection, transportation, and processing for viral culturing can be found in several reference texts [14]. Likewise, procedures for inoculation of cell cultures can vary based on the type of specimen collected (for example respiratory sample versus stool sample) and strains of virus suspected. In order to speed-up virus isolation, rapid culture methods such as centrifugation-enhanced (shell vial) techniques were developed that has dramatically improved the turn-around time from 7 days to 24–48 hours [15]. In recent years, the shell vial technique has greatly improved the virus isolation for many viruses including influenza, dengue and respiratory viruses [16-18]. After infection, cell monolayers are screened by microscopic examination every day for CPE, viral inclusion bodies, syncytia, and cell rounding vacuole formation.
- Cell culture growth medium (DMEM high glucose with 4 to 6 mM glutamine and 10% fetal bovine serum), Penicillin, Streptomycin, Gentamicin, Fungizone can be added if required
- Maintenance medium (fresh cell culture growth medium as above, but in 2% serum)
- Host cells monolayer grown on 8 well chamber slides
- Phosphate buffered saline
- Bouin's fixative
- Giemsa buffer
- Giemsa stain
- Acetone, acetone:xylene (2:1 and 1:2), xylene
- Permount
- Micropipettes (10 to 100 microliter)
- Microcentrifuge tubes
- Microbiological safety cabinet
- CO2 incubator
- Inverted microscope
- Seed chamber slides with host cells: Plate host cells at an approximate density (for example, 30,000 cells/chamber in an 8-well chamber slide) in growth media. Gently rock chamber slides back and forth and from side to side so that cells are distributed evenly. Once cells have been seeded, allow the cells to grow overnight. Next day, visualize cells under a light microscope to confirm that cells are evenly distributed and reached >80% confluency.
- Prepare serial dilutions of viruses: On the day of infection, label 6 sterile microcentrifuge tubes to prepare virus dilutions. Fill the first tube in series with 990 μl of growth medium and remaining 5 tubes with 0.9 ml of growth medium. Make a series of dilutions as follows; make a 1:100 dilution by transferring 10 μl of original virus stock to the first tube containing 990 μl of medium. Thereafter transfer 100 μl of the diluted virus to the next tube. Repeat to make a serial 1:10 dilution of the virus stock such as 10-3 through 10-7.
- Infect monolayer cells: Remove cell culture growth medium from chambers slides and add 0.5 ml of maintenance medium to each well. Add 100 μl of the 10-2 to 10-7 dilution to one of the wells, leaving one uninoculated control well for each set of virus tested. Place infected cells back to CO2 incubator at 37oC or 34oC for monitoring CPE for one to four week.
- Giemsa stain for cell cultures: Once CPEs are visible, gently wash chambers slides with 3X PBS (5 minutes/wash) and treat them in Bouin's fixative for 10 minutes. Rinse the slides 3X in Giemsa buffer (10 minutes/wash) followed by incubation in Giemsa stain for 1 hour. Rinse slides briefly in Giemsa buffer and treat them in acetone for 15 seconds, acetone-xylene (2:1) for 30 seconds, acetone-xylene (1:2) for 30 seconds and finally in xylene for 10 minutes and then mount with permount. Examine the chamber slides for CPE, inclusion bodies, syncytia, and viral vacuoles. Many atlases, numerous websites and blogs demonstrate excellent CPE pictures of virus-infected cells.

Immunofluorescence (IF) technique is widely used for rapid detection of virus infections by identifying virus antigens in clinical specimens [19-22]. IF staining is usually considered very rapid (about 1 to 2 hr) and overall gives a sensitive and specific viral identification [19-22]. Unfortunately, IF technique may not able to confirm the identity of all virus strains, for instance viruses of the “enterovirus” group; since most monoclonal antibodies (MAbs) for enteroviral identification have been shown to lack sensitivity, while cross-reactivity with rhinoviruses is extremely common [23]. In contrast, IF has been successfully used for better management of influenza virus infection and surveillance of influenza virus activity [20, 21]. As recommended by CDC, when influenza activity is low, positive results should be confirmed by direct immunofluorescence assay (DFA), viral culture, or RT-PCR, as false positive test results are more likely; while during peak influenza activity confirmatory testing using DFA, viral culture, or PCR must always be considered because a negative test may not rule out influenza viral infection. Interestingly, although IF is generally considered less sensitive then ELISA and PCR, a recent publication reports DFA as an optimal method for rapid identification of varicella-zoster virus (VZV), when compared with conventional cell culture [24]. In contrast, the Herpes simplex virus (HSV) DFA test accuracy was found very low (sensitivity 61%, specificity 99%), when tested to identify mucocutaneous HSV infection in children [25]. Furthermore, a monoclonal antibody designated CHA 437 was developed against HSV showed no cross-reactivity against the varicella-zoster virus, cytomegalovirus, or Epstein-Barr virus, however direct specimen testing resulted in overall low sensitivity (84.6%) and specificity (95.7%) [26]. On the other hand, an antigen detection assay for severe acute respiratory syndrome (SARS) coronavirus (CoV) could detect SARS-CoV in 11 out of 17 (65%) samples from SARS patients [27].
As such IF technique is well-accepted laboratory diagnostics test, however, sometime these assays could be quite expensive, due to the cost of antibodies used. Additional variability may also be introduced due to non-specific binding, or cross-reactivity of commercially available antibodies.
- Cell culture growth medium (DMEM high glucose with 4 to 6 mM glutamine and 10% fetal bovine serum), Penicillin, Streptomycin, Gentamicin, Fungizone can be added if required
- Host cells monolayer grown on 8 well chamber slides
- Phosphate buffered saline
- Antigen-specific primary antibody
- FITC-conjugated secondary antibody
- DAPI
- 5-4% Paraformaldehyde solution (pH 7.4) or methanol
- Micro pipettes (10 to 100 microliter)
- Microcentrifuge tubes
- Microbiological safety cabinet
- CO2 incubator
- Epifluorescence microscope
- Seed chamber slides with host cells: Cells are plated at an approximate density (for example 30,000 cells/chamber in an 8-well chamber slide) in growth media. Gently rock chamber slides back and forth and from side to side so that cells are distributed evenly. Once cells have been seeded, allow the cells to grow overnight. Next day, visualize cells under a light microscope to confirm that cells are evenly distributed and reached >80% confluency.
- Infect monolayer cells: Add 0.1 ml of original virus stock to each well, leaving one uninoculated control well. Place infected cells back to CO2 incubator at 37°C or 34°C for 48 hrs.
- Staining and visualization of IF: Forty-eight hours post-infection, aspirate the medium and then fixed cells with ice-cold methanol for 5 minutes (alternatively fix in freshly prepared 4% paraformaldehyde solution, and then permeabilize in 0.2% Triton X-100 for 5 min at RT). The cells need to be rinsed with PBS and then incubated with a suggested dilution of antigen-specific primary antibody for 2 hours. Remove unbound primary antibody by washing 5X with PBS. Add fluorescently conjugated (Alexa Fluor 488 or FITC-conjugated) secondary antibody immunoglobulin G to the monolayer of cells. Following incubation, wash the cells again 5X in PBS, then add DAPI and visualized under phase and epifluorescence microscope.
Figure 1 shows a double-staining of canine distemper virus-infected canine footpad keratinocytes cells [1].

The development of molecular methods for the direct identification of a specific viral genome from the clinical sample is one of the greatest achievements of the 21st century. Clearly nucleic acid amplification techniques including PCR, nucleic acid sequence-based amplification (NASBA) and Lawrence Livermore Microbial Detection Array (LMDA) are proven technology leaders for rapid detection and molecular identification for most known human viruses. As such, PCR allows the in vitro amplification of a specific region of DNA sequences by a factor of 106 and thus considered as an extremely sensitive detection technique. PCR analysis can also be used to determine viral RNA, by adding an initial step in which the RNA is converted into DNA; know as reverse transcriptase PCR (RT-PCR). Several RT-PCR assays for influenza virus identification have been described since the first report by Zhang and Evans in 1991 [28]. Direct RNA sequencing using an Oxford Nanopore flow cell has been used to verify SARS-CoV 2 [29]. Figure 2 demonstrates the typing of influenza A virus by type-specific primers (unpublished data). The technique of PCR and analysis has been described in details at Labome

Real-time RT-PCR assays for influenza virus detection provides faster results than end-point assays and in many cases have sensitivities equal to or better than culture [30]. The novel coronavirus, 2019-nCoV, emerging from Wuhan, China in December 2019, was detected through real-time RT-PCR with primers against two segments of its RNA genome [31]. Di Mascio M et al used nested hybrid real-time/digital RT–PCR and PCR assays targeting SIV gag gene to estimate SIV viral load in plasma and tissues [32]. Figure 3 shows a schematic diagram illustrating the basis of real-time PCR. In a previous study real-time PCR was found most sensitive for quantitation of respiratory syncytial virus (RSV) in nasal aspirates of children, when compared with immunofluorescence assay and culture methods [33]. Unfortunately, high mutation rates may lead to extensive changes in viral nucleic acid sequences making dedicated PCR primer use irrelevant, therefore there is high demand for the development of rapid and universal virus identification and detection technologies. In contrast, although NASBA assay is considered sensitive; it has not been widely used because of the difficulties in the preparation of NASBA master mix in-house and the high cost of commercial kits. A new molecular biology-based microbial detection method for rapid identification of multiple virus types in the same sample has been developed by a research group at Lawrence Livermore National Laboratory. Lawrence Livermore Microbial Detection Array (LLMDA) detects viruses using probes against genomic DNA sequence within 24 hours [34, 35]. In addition, the oligonucleotide probes were selected to enable detection of novel, divergent species with homology to sequenced organisms [35].
Viral plaque assay is one of the most widely used methods in virology to purify a clonal population of virus or to determine viral titer [36-40], include SARS-CoV-2 [41]. Renato Dulbecco was first to develop this procedure in 1952 to calculate the infectivity of bacteriophages stocks, and since then it has been used widely to quantify many different viruses [42-45]. A plaque usually is the result of infection of the cell by a single virion on the host cell monolayer. As such, to perform a plaque assay, susceptible host cell monolayer is infected with 10-fold serial dilutions of virus. After an incubation period, monolayers are then covered with a semi-solid nutrient medium, (most commonly agar) to prevent the virus from spreading from host cells to other nearby uninfected cells. As a result, each infectious particle produces a small circular zone in the monolayer called a plaque, while uninfected cells surround the plaques. Eventually the plaque becomes large enough to be visible to the naked eye or with light microscopy. Figure 4 demonstrates a schematic representation of the viral plaque assay. Counting of individual plaque produced at particular dilution provides the number of infectious virions or plaque-forming units (PFU) per milliliter. Since each plaque represents one virus particle, clonal virus populations can also be purified by isolating these individual plaques. However, it is often necessary to stain cells with dyes (MTT or neutral red) to enhance the contrast between the living cells and the plaques. Additionally, conditions of cells are critical for a successful plaque assay, therefore healthy host cells in log-phase with > 95% viability at the time of the assay are required. As such, viral plaque assay is usually considered time-consuming since it usually requires between 4 to 10 days, depending on the virus being analyzed. Furthermore, plaque assay is only considered effective for viruses that are capable of multiplying, infect monolayer cells and for viruses that breakdown cells. Relative errors associated with the plaque assay have been shown to be 10–100%, whereas TCID50 has about a 35% error [46].

- Cell culture growth medium (DMEM high glucose with 4 to 6 mM glutamine and 10% fetal bovine serum), Penicillin, Streptomycin, Gentamicin, Fungizone can be added if required
- Plaquing Medium (DMEM high glucose with 4 to 6 mM glutamine and 2% fetal bovine serum)
- Host cells
- Phosphate buffered saline
- Plaque assay agarose, ultrapure
- Staining dye for plaque (MTT or neutral red)
- Tissue culture grade sterile water
- Micro pipettes (10 to 100 microliter)
- 6-well tissue culture plates (could be pre-coated with a collagen solution)
- Microcentrifuge tubes
- Water bath
- Microwave oven
- Inverted microscope
- Microbiological safety cabinet
- CO2 incubator
- Seed culture plate with host cells: Seed 1 x 10⁶ cells per ml in growth media of each well of 6-well plates. Gently rock culture plates back and forth and from side to side so that cells are distributed evenly. Once cells have been seeded, allow the cells to grow overnight. Next day, visualize cells under a light microscope to confirm that cells are evenly distributed and reached >80% confluency.
- Prepare agarose solution: Melt 10 ml of sterile 2% agarose in H2O (autoclaved) and keep the agarose molten in a 42°C water bath. Pre-warm the culture media to 37°C. (After 1 hour, confirm the agarose solution is at 42°C and warm enough so that it is still in the liquid state, but it should be cool enough to hold by hand).
- Prepare serial dilutions of viruses: Label 6 sterile microcentrifuge tubes to prepare virus dilutions. Fill the first tube in series with 990 μl of growth medium and remaining 5 tubes with 0.9 ml of growth medium. Make a series of dilutions as follows; make a 1:100 dilution by adding 10 μl of original virus stock to the first tube containing 990 μl of medium. Thereafter transfer 100 μl of the diluted virus to the next tube. Repeat to make a serial 1:10 dilution of the virus stock such as 10-3 through 10-7.
- Infect monolayer cells: Remove medium in the 6-well plates using a sterile Pasteur pipette. Add 100 μl of the 10-3 to 10-7 dilution to one of the wells, leaving one uninoculated control well for each set of virus dilutions. Repeat for the second plate. Incubate at room temperature for 1 hour to allow the virus to infect the cells.
- Overlay infected cells with agarose: After 1 hour, carefully remove the virus without dislodging the cells. Mix 1:1 warm culture media with 2% agarose and gently add 1.5 ml of the 1% agarose to overlay cells into each well. Leave cells at room temperature for at least 20 minutes, with no disturbance to plates until the agarose overlay has set. Add 1.5 ml of the culture medium to each well and incubate the plates at room temperature or 27°C for 6-10 days.
- Visualization and counting of plaques: Plaques can be visualized illuminating them against the light coming from the side (45° angle) of the plate, or by inverting the plates on a dark background. To identify a plaque, it is a good idea to circle the plaques. To facilitate visualization of plaques, overlay 1 ml of 0.03% neutral red in water or PBS to each well and incubate the plate at room temperature or 27°C for 2-3 hours. Uninfected cells will be stained with neutral red and the plaques will then appear as small clear areas (approximately 0.5 - 3 mm in diameter against a white background).
Count the plaques on each well and determine the virus titer as follows: Virus titer (pfu/ml) = number of plaques * (1 ml / 0.1 ml) / fold of dilution
Although plaque assay is an extremely useful method for determining viral titers, however there are several virus types which do not form plaques in culture. Alternative procedures such as TCID50, LD50, EID50 assays are being used to determine the infectious titer of any such virus types, which can cause cytopathic effects (CPE) in tissue culture over a reasonable period of 5 to 20 days while cells in culture remain viable. However, since not all virus types cause CPE in tissue culture, and therefore cell line and virus must be carefully matched in order to see a cytopathic effect. TCID50 is the tissue culture infectious dose defined as that dilution of virus required to infect 50% of the cell monolayers. There are several statistical methods for analyzing the data generated (e.g., Spearman-Karber analysis or Probit formula). A TCID 50 was found of greatest value when lack of experimental material or costs of analysis precludes extensive replicate titer determinations but good estimates of titers and/or treatment differences are essential [39]. Relative errors associated with the plaque assay have been shown to be 10–100%, whereas TCID50 has about a 35% error [46]. As such TCID50 are being used for a plethora of application both in experimental and diagnostic virology including HIV-1, human herpesvirus and influenza [39, 47, 48]. However, TCID50 assay is generally considered time-consuming that could take up to 7 days due to the time required to establish infection in cell culture. Using the method of Reed & Muench, below is an example to determine the TCID50 value in the experiment [49].
- Cell culture growth medium appropriate for cell line (DMEM high glucose with 4 to 6 mM glutamine and 10% fetal bovine serum), Penicillin, Streptomycin, Gentamicin, Fungizone can be added if required
- Maintenance medium (fresh cell culture growth medium as above, but in 2% serum)
- Host cells
- Phosphate buffered saline
- Micro pipettes (10 to 100 microliter)
- 48-well flat bottom tissue culture plates
- Falcon tubes
- Water bath
- Microwave oven
- Inverted microscope
- Microbiological safety cabinet
- CO2 incubator
- Seed culture plate with host cells: Seed 7 x 10⁴ cells per ml in growth media on each well of 48-well plates. Gently rock plates back and forth and from side to side so that cells are distributed evenly. Once cells have been seeded, allow the cells to grow overnight. Next day, visualize cells under a light microscope to confirm that cells are evenly distributed and reached >80% confluency.
- Prepare serial dilutions of viruses: On the day of infection, prepare 1:10 dilution of the original virus stock in growth medium as follows. For each virus sample, label 24 sterile falcon tubes; arrange 6 tubes in a row, while each row contains 4 tubes in a column. Fill the first tube in each column with 990 μl of medium and remaining 5 tubes in series with 0.9 ml of medium. Briefly mix original virus stock and make a 1:100 dilution by transferring 10 μl of virus stock to the first tubes of each column containing 990 μl of medium. Thereafter transfer 100 μl of the diluted virus to the second tubes in the series. Repeat to make a serial 1:10 dilution of the virus stock such as 10-3 through 10-7.
- Infect monolayer cells: Label lids of 48-well plates in quadruplicates for each virus sample (label each grid to denote virus sample and the row for virus dilutions). Include four negative wells on each plate which will not be infected. Carefully remove all but 0.1 ml of media from each well. Gently add 0.1 ml of virus dilution per well, infecting 4 wells per dilution, proceeding backwards through the dilutions. Allow virus to adsorb to cells at 37°C for 2 hours (some virus types grow better at 34°C, for example influenza) followed by adding 0.5 ml infection medium to each well and place plates back to CO2 incubator at 37°C or 34°C for monitoring CPE for one to four week.
- Visualization and calculation of TCID50: CPE can be visualized under an inverted microscope by observing wells inoculated with virus dilutions. The titer can then be calculated based on the method of Reed and Muench [49].
Example - Figure 5 demonstrates an example of a TCID50 based end-point dilution assay. As shown, four monolayer cell cultures were infected with a series of dilutions of the virus sample. After a specific incubation period, CPE displaying samples were scored as +. As seen in the figure, at 10-5 dilution half of the inoculated cells showed CPE and other half do not. Therefore this is the endpoint (the dilution of the virus at which 50% of the cell cultures are infected). This number can be calculated from the data and expressed as 50% infectious dose (ID50) per milliliter. Therefore, the virus stock in this example contains 105 ID50 per ml.
Similarly, end-point dilution methods can also be used to determine the titer of a virus suspension by inoculating them in animals. As described above for TCID50, serial dilutions of viruses are similarly prepared and then inoculated into several test animals instead of cell lines. Infections of animals are measured by death or clinical symptoms such as fever, weight loss, or paralysis. Accordingly, the results are expressed as 50% lethal dose (LD50) per ml or 50% paralytic dose (PD50) per ml where lethality or paralyses are used as endpoints.


The IFA (also known as fluorescent foci assay FFA) is a rapid method of virus titration that allows the quantification of virus in cell lines, which does not support plaque formation or do not exhibit detectable CPE (to perform TCID50). For example, hepatitis A virus (HAV) does not produce visible CPE without multiple passages in cell culture [50]. In contrast to other infectivity-based assays, IFA is not dependent on the ability of induction of cell death, but it utilizes an antibody-based staining methods to detect virally infected cells as early as two days—long before than any other infectivity-based detection method including standard plaque assays and TCID50. The results of IFA are expressed in focus forming units FFU/ml per ml, or IFU/ml. As such IFA are being used for plethora of application both in experimental and diagnostic virology including HIV-1, dengue, and influenza [51-54]. In a previous study, IFA was found less sensitive for quantitation of RSV in nasal aspirates of children, when results were compared with real-time PCR methods [33]. However, in another study, IFA was found highly sensitive and specific for quantification and detection of infectious human adenoviruses types 2 and 41 and JC polyomaviruses strain Mad-4 in water samples when compared with plaque assay, TCID50 and quantitative PCR [55]. Figure 6 shows IFA of Vero E6 cells infected with Chilean hantavirus CHI-7913 isolate [3].

Overall IFA is considered more sensitive and faster than traditional plaque assays or TCID50, however it sometimes could be quite expensive, due to the cost of antibodies used. Unfortunately, sometimes required antibodies may not be commercially developed as well. In contrast, attempts to develop antibodies in-house may be quite expensive. Additionally, variability may be introduced due to differences in the person doing the actual counting, high background signals generated by non-specific binding, or cross-reactivity with non-viral protein targets. Figure 7A and 7B show a schematic representation of direct IFA and indirect IFA methods respectively.
- Cell culture growth medium (DMEM high glucose with 4 to 6 mM glutamine and 10% fetal bovine serum), Penicillin, Streptomycin, Gentamicin, Fungizone can be added if required.
- Maintenance medium (fresh cell culture growth medium as above, but in 2% serum)
- Fluorescence-conjugated primary antibodies (direct IFA) or unconjugated primary antibody (for indirect IFA)
- FITC-conjugated secondary antibody (for indirect IFA)
- Host cells
- Phosphate buffered saline
- 4% Paraformaldehyde solution (pH 7.4) and Triton X-100 or methanol
- DAPI (for nuclear stain) or 50% glycerol in water
- Micro pipettes (10 to 100 microliter)
- 48-well flat bottom tissue culture plates
- Microcentrifuge tubes
- Epifluorescence microscope
- Sonicator
- Microbiological safety cabinet
- CO2 incubator
- Seed culture plates with host cells: Seed 7 x 10⁴ cells per ml in growth media on each well of 48-well plates. Gently rock plates back and forth and from side to side so that cells are distributed evenly. Once cells have been seeded, allow the cells to grow overnight. Next day, visualize cells under a light microscope to confirm that cells are evenly distributed and reached >80% confluency.
- Prepare serial dilutions of viruses: On the day of infection, prepare 1:10 dilution of the original virus stock in growth medium as follows. For each virus sample, label 24 sterile falcon tubes; arrange 6 tubes in a row, while each row contains 4 tubes in a column. Fill the first tube in each column with 990 μl of medium and remaining 5 tubes in series with 0.9 ml of medium. Briefly mix original virus stock and make a 1:100 dilution by transferring 10 μl of virus stock to the first tube of each column containing 990 μl of medium. Thereafter transfer 100 μl of the diluted virus to the second tubes in the series. Repeat to make a serial 1:10 dilution of the virus stock such as 10-3 through 10-7.
- Infect monolayer cells: Label lids of 48-well plates in quadruplicates for each virus sample (label each grid to denote virus sample and the row for virus dilutions). Include four negative wells on each plate which will not be infected. Carefully remove all but 0.1 ml of media from each well. Gently add 0.1 ml of virus dilution per well, infecting 4 wells per dilution, proceeding backwards through the dilutions. Allow virus to adsorb to cells at 37°C for 2 hours (some virus types grow better at 37°C, for example influenza) followed by adding 0.5 ml maintenance medium to each well and place plates back to CO2 incubator at 37°C or 34°C for performing immunostaining after 48- 72 hours (for some cells it may take up to 4-5 days as infection subsequently spread to adjacent cells and increasing numbers of cells comprised the infected foci seen).
- Staining, visualization and calculation of FFU/ml: Forty-eight hours post-infection, aspirate the medium and then fixed cells with ice-cold methanol for 5 minutes (alternatively fix in freshly prepared 4% paraformaldehyde solution, and then permeabilize in 0.2% Triton X-100 for 5 min at RT). The cells need to be rinsed with PBS and incubated with a suggested dilution of fluorescence conjugated (Alexa Fluor 488-conjugated or FITC-conjugated) primary antibody (for direct IFA) or unconjugated primary antibody (for indirect IFA) for 2 hours. Remove unbound primary antibody by washing 5X with PBS. Add fluorescent-conjugated secondary antibody immunoglobulin G to the monolayer of cells (for indirect IFA). Following incubation, wash the cells again 5X in PBS, and add 50% glycerol or DAPI and then visualized under phase and epifluorescence microscope. The viral titer then can be expressed in terms of fluorescent focus units per milliliter (IFU/ml).
Virus titer (IFU/ml) = average no. of foci per well x dilution factor x volume factor (for conversion to milliliters)
PCR is one of the most widely used laboratory methods for detection of viral nucleic acids. PCR analysis can also be used to determine viral RNA, by adding an initial step in which the RNA is converted into DNA; know as reverse transcriptase PCR (RT-PCR). Real-time PCR (also known as quantitative PCR, qPCR) is the method for the determination of the quantitative analysis of nucleic acids, while the reaction is in progress. There are two variations of real-time PCR: probe-based (also known as TaqMan PCR) and intercalatory dye-based (also known as SYBR Green method). As such qPCR are being used for a plethora of application both in experimental and diagnostic virology including HIV-1, dengue, and influenza [56-58]. Figure 3 shows a schematic diagram illustrating the basis of real-time PCR. Another variation of PCR, called ddPCR, has also been used for determining the viral titers. However, ddPCR and qPCR can yield different measurements, up to an order [59]. The technique of PCR and analysis has been described in details at Labome.
Immunoblotting (also known as western blot; WB analysis) technique detects specific viral proteins isolated from a cell, tissue, organ, or body fluid. As such, whole cell extract is solubilized with detergent and subjected to polyacrylamide gel electrophoresis (SDS-PAGE) analysis, which allows individual protein separation according to size by PAGE. The viral proteins are then transferred onto nitrocellulose paper and the bound antibodies can then be visualized using extremely sensitive indicator molecules (for example, reporter enzymes such as alkaline phosphatase and horseradish peroxidase). Figure 8 shows a schematic summary of a standard immunoblotting assay.

The development of sensitive and specific tests for human immunodeficiency virus type 1 (HIV-1) progressed rapidly after this retrovirus was found to be responsible for causing AIDS [60]. Immunoblotting has been one of the reference confirmatory tests for the diagnosis of HIV infection or after inconclusive enzyme immunoassay (EIA) results. Although difficulty in interpretation of immunoblotting results and the cost led to a reduction in overall use of WB technique, nevertheless immunoblots are still commonly used for various purposes, including clinical diagnosis of HIV-1, seroprevalence surveys, and for blood-donor screening ( CDC). In addition, immunoblot assays have been used to confirm the anti-hepatitis C virus (HCV) reactivity [61]. In recent years immunoblotting has been established as an important prerequisite for the functional studies to understand protein composition of the purified viral particles, since it allows the analysis of specific proteins which result in better understanding of the infection process and the pathogenesis of viruses [62, 63]. The technique of immunoblotting has been described in details at Labome.

Immunoprecipitation method utilizes specific antigen-antibody interaction and binding of protein A/G to FC fragment of an antibody. As most IP performed, protein A/G is first allowed to bind to agarose beads, that reacts with a mixture of sample solution (antigen) and antibody. Thus protein A/G on the beads adsorbs the target antigen which can be easily isolated from a mixture of proteins in a sample solution by low-speed centrifuge. The samples are then analyzed by SDS-PAGE to determine their quantity and molecular weights of proteins, study protein-protein interaction or to monitor protein post-translational modifications. As such, simple immunoprecipitation techniques may not be directly useful for proteomic analyses due to the high degree of background proteins usually present in the samples, however, this approach can been used successfully for proteomic analyses using highly specific antibodies, particularly if they are covalently coupled to beads, reducing the amount of the antibody in the final sample [64]. For instance, immunoprecipitation has been used to extensively to identify interactions with herpes simplex virus type 1 (HSV-1) proteins ICP8 and ICP27 [65, 66]. Similarly a novel method for purifying BTV-10 by cell debris co-immunoprecipitation with agarose Protein A was developed [67]. As such immunoprecipitation-based studies are being used for a plethora of application both in experimental and diagnostic virology including RSV, Ebola, influenza and HCV virus and influenza [68-71]. In addition, combining the procedures of immunoprecipitation and immunoblotting could successfully overcome some of the limitations of each separate procedure [72]. For example, immunoblotting identifies immunoprecipitated proteins more specifically, while immunoprecipitation can enrich proteins of interest to improve overall sensitivity for detection [72]. Recently, immunoprecipitation-blotting helped to characterize a new autoantibody, anti-p155, and to test for the presence of the autoantibody in patient sera to study its clinical associations [72]. Figure 9 shows a schematic summary of a standard immunoprecipitation assay.
- Primary antibodies
- Protein A or G Agarose Beads: prepare according to manufacturer’s instructions. Use Protein A for rabbit IgG pull down and Protein G for mouse IgG pull down.
- Cell Lysis Buffer: add1 mM PMSF immediately prior to use.
- 3X SDS Sample Buffer: Tris-HCl (pH 6.8 at 25°C), 6% w/v SDS, 30% glycerol, DTT, bromophenol blue
- Phosphate buffered saline
- 10 cm2 cell culture plates
- Microcentrifuge tubes
- Micropipettes (10 to 100 microliter)
- Cell scraper
- Sonicator
- Centrifuge
- Preparing cell lysates: spirate media and rinse cells once with ice-cold PBS. Remove PBS and add 0.5 ml ice-cold 1X cell lysis buffer to each plate (10 cm2) and incubate the plates on ice for 5 minutes. Scrape off the cells from plates and transfer to microcentrifuge tubes while keeping the plates on ice. Sonicate samples on ice three times and then collect supernatant by centrifugation for 10 minutes at 14,000 X g, 4°C.
- Immunoprecipitation: Collect 200 μl cell lysates, add primary antibody (specific dilutions; as a starting point use 1-10 ug) and incubate the samples with gentle rocking overnight at 4°C. Add 50 ul of either protein A or G agarose beads and incubate with gentle rocking for 1–3 hours at 4°C. Thereafter, centrifuge the samples for 30 seconds at 3000X rpm, 4°C. Wash the pellet 2-4 times with 500 µl of ice-cold 1X cell lysis buffer while maintaining the plates on ice. Resuspend the pellet with 20 μl 3X SDS sample buffer. Boil the samples to 95–100°C for 5-10 minutes, load and run on an SDS-PAGE gel and analyze samples by immunoblotting. The technique of immunoblotting has been described in details at Labome.
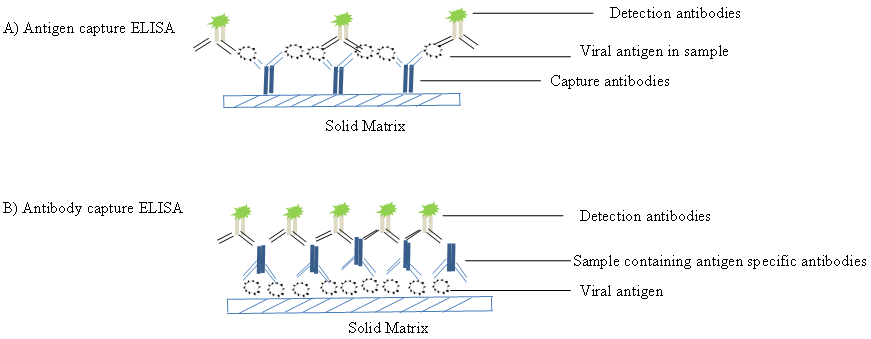
Enzyme-linked immunosorbent assays (ELISAs) (also known as enzyme immunoassay EIA) incorporate the sensitivity of simple enzyme assays with the specificity of antibodies, by employing antigens or antibodies coupled to an easily-assayed enzyme. As such ELISA is much more rapid method than immunoblotting to detect specific viral protein from a cell, tissue, organ, or body fluid. There are two main variations of ELISAs: antigen-capture ELISA (detecting viral proteins), involve attachment of a capture antibody to a solid matrix for the viral protein of interest, while antibody-capture ELISA measures the specific antibody level in a sample, by coating viral antigen protein on a solid surface. Figure 10 demonstrates schematic representation of two principles based on antigen-capture and antibody-capture ELISAs. In a general, ELISAs are considered a highly sensitive method that can detect a fairly low amount of proteins at the range of picomolar to nanomolar range (10-12 to 10-9 moles per liter). ELISA has been one of the most widely used serologic tests for detecting antibody to HIV-1 (see the CDC document). ELISA method was found useful as a diagnostic tool to detect influenza viral antigen much quicker than other conventional virus detection methods [73]. In another previous study, comparison of ELISA (directigen FLU-A), with conventional methods has demonstrated ELISA superiority for the rapid detection and identification of influenza A virus [74]. A simplified and standardized neutralization enzyme immunoassay (Nt-EIA) was developed to detect measles virus growth in Vero cells and to quantify measles neutralizing antibody [75]. Newer EIA formats for hepatitis C virus diagnostics have been constantly evaluated [76, 77]. As such ELISAs are being used for plethora of application both in experimental and diagnostic virology including HIV-1, dengue, and influenza [78-80]. On the other hand, although rapid than traditional plaque assays or TCID50, ELISA assays sometimes could be quite expensive, due to the cost of reagents used. Unfortunately, sometimes required antibodies may not be commercially developed as well. In contrast, attempts to develop antibodies in-house may be quite expensive. Additional variability may also be introduced due to high background signals generated by non-specific binding, or cross-reactivity with non-viral protein targets.
- Coating buffer (50 mM sodium carbonate, pH 9.6; 20 mM Tris-HCL, pH 8.5).
- Wash solution (PBS-Tween) (1 ml of Tween-20 in 1 L PBS)
- Blocking solution (1% BSA in PBS or non-fat dry milk)
- Primary and secondary antibody (these antibodies should be diluted in 1x blocking solution)
- TMB solution in 0.1M Sodium acetate buffer (by adding 30% hydrogen peroxide to final concentration of 0.01% acetate)
- Micropipette (10 to 100 microliter)
- Maxisorp flat-bottom 96 well plates (Nunc™)
- Centrifuge tubes
- Absorbance-based microplate ELISA reader
- Antibody coating: Dilute antibody in a coating buffer (plated at 0.2 to 10 µg/ml) and transfer 100 µl to each well of Nunc™ Maxisorp flat-bottom 96 well plates. Seal the plates with adhesive film to avoid evaporation and incubate either at +4°C overnight or at RT for 2 hours (alternatively at 37°C for 1 hour). Next day discard coating solution out of wells and wash 2 X times with distilled/de-ionized water.
- Blocking the plates: Block wells by adding 50-200 μL of blocking solution to each well and incubate for 1 hour at 37°C /room temperature, wrapped in plastic or in a moist sealed container.
- Application of samples (viral antigen): Discard blocking solution and dilute samples to desired concentrations in blocking solution. Add 100 μl sample containing viral antigen per well and incubate the plates at room temperature for 2-4 hours or at 4°C. Remove the samples and wash ≥ 3 times with the wash solution or distilled water.
- Application of detection antibodies: Dilute and add 0.2 ml of appropriately diluted detection antibody (enzyme-labeled detection antibody (follow the manufacturer instructions), and incubate the plates at room temperature for 30 minutes. Remove the detection antibody solution, wash the plate 3X times with the washing buffer and add the appropriate TMB substrate solution. Allow the plate to develop (typically 30 minutes) and add stop solution (optional). Read the absorbance at the appropriate wavelength in a microplate ELISA reader.
- Antigen coating: Dilute antigen in a coating buffer (plated at 0.2 to 10 µg/ml) and coat ELISA wells with 100 µl of antigen to Nunc™ Maxisorp flat-bottom 96 well plates. Cover the plates with adhesive film and incubate either at +4°C overnight or at RT for 2 hours (alternatively at 37°C for 1 hour). Next day remove coating solution from each well and wash plates 2 X with distilled/de-ionized water.
- Blocking the plates: Block wells by adding 50-200 μL of blocking solution to each well and incubate for 1 hour at 37°C /room temperature, wrapped in plastic or in a moist sealed container.
- Applying antibodies: Discard blocking solution and add sample (containing antigen-specific antibody) per well and incubate at 37°C for 1 hour. The recommended antibody dilutions are 1:10, 1:100, 1:1000, 1:10,000 and undiluted. Remove specific antibodies and wash 10 X with the wash solution or distilled water. Dilute secondary antibody with blocking solution (at dilutions as recommended by manufacturer). Add 100μl per each well, seal and incubate for 1 hour at RT on a rocking platform or at 37°C.
- Add substrate and develop: Add TMB solution 100μl per well and allow time to develop the signal at RT for 5, 15, 30 min (typically 30 minutes). (If needed, once required color developed, 50μl of stop solution, 10% (v/v) phosphoric acid could be added to stop the reaction). Read the absorbance at the appropriate wavelength in a microplate ELISA reader.

The hemagglutination assay (HA) is a most common indirect method to quantify the number of virus particles, generated from the cell culture supernatant or amnio-allantoic fluid harvested from chicken eggs. This assay relies on the fact that many viruses contain proteins (for example influenza virus hemagglutinin (HA) protein) that can bind and agglutinate red blood cells (RBC). Although there have been a number of key advances from Salk in the 1940s, overall HA method has remained largely unchanged and has been described for measuring the number of viral particles based on its agglutination property [81-83]. As such, the principle of this assay is simple; however sample preparation is considered laborious and presents some drawbacks. For instance, to obtain reproducible results, the RBC has to be freshly prepared as their agglutination properties decline over time. Additionally, since individual RBC source could be different in origin, therefore assay standardization with reference standard is usually required. Moreover, HA, unlike other methods of virus quantification (such as a plaque assay or TCID50) does not provide any estimates of viral infectivity, since virus replication is not required for this assay.
During the test, RBC will fall to the bottom of a culture well, forming a sharp dot; however the presence of HA protein on the viral surface would agglutinate the RBC, thus preventing them from settling out of suspension. Therefore by serially diluting a virus and adding a consistent amount of RBC, an estimation of virus titer can be made. Figure 11 demonstrates a schematic representation summary of a standard hemagglutination assay.
- Turkey RBC
- Phosphate buffered saline
- 15 ml conical tubes
- Micropipette (10 to 100 microliter)
- Disposable pipettes – 1 ml, 5 ml, 10 ml
- Round-bottomed 96-well dish
- Centrifuge
- Certified biological safety cabinet
- Viral titration: Add 50 μl of PBS to each well of a round-bottomed 96-well dish. Add 50 μl of virus sample to the first well, mix, and then transfer 50 μl to the second and subsequent wells. Discard 50 μl from the last well into a bleach solution. Add 50 μl of 0.5% red blood cell working solution to each well. Mix gently and leave the plate at 30-60 minutes to develop. Negative results will appear as dots while positive results will form a uniform reddish color across the well.
- Results calculation: Lattice forming parts need to be counted and then the titer can be calculated by the method described by Donald and Isaacs [84]. Virus concentration in virions per milliliter = 107 x HA titer.
FCM based virus quantification was first described for baculovirus particles produced from insect cell cultures [85] and thereafter Brussaard et al successfully demonstrated FCM quantification for a variety of other viruses having different morphologies and genome sizes [86]. Direct comparison showed that epifluorescence- and FCM-based virus counts were highly comparable. As such, SYBR Green I or SYBR Gold has been extensively used for FCM counts of viruses [87, 88]. SYBR Green I is a highly sensitive cyanine-based fluorescent dye that binds to double-stranded DNA (dsDNA) and RNA. Although DAPI has been used for FCM quantification of viruses; however this dye produces overall dull staining of the virus particle, thus making counting difficult. In contrast, SYBR Green I fluorescent stains is highly preferred due to its extreme brightness and low background. As such, FCM is being used successfully to count viruses from laboratory experiments and in natural samples [89, 90]. Recently Gates et al developed a new FCM assay to measure the infectivity of the attenuated vaccine strain (vOka/Merck) of Varicella-zoster virus (VZV) in MRC-5 cells with an improved higher-throughput alternative to the plaque assay [91]. In addition, several new FCM based protocols were developed to measure HIV-1 viral load [92, 93]. Furthermore, a method using FCM was developed to quantitate total baculovirus particles produced from insect cell cultures [94]. Sivaraman D et al suggested that FCM may be adapted for the practical diagnosis of multiple viral infections [95]. Compared to fluorescence microscopy, FCM allows acquisition of statistically reliable data on the single-cell level with comparatively little effort and the fluorescence distributions obtained from FCM can be used for further data analyses, such as statistical evaluation of process data and mathematical modelling of virus protein production and virion release [96]. In the recent past, a cell-based reporter system using cells expressing a fluorescent protein pair undergoing fluorescence resonance energy transfer (FRET) has been developed for the rapid detection of viral infection. FCM can be employed to determine FRET signals due to its capacity to detect overlapping signals from individual fluorescent proteins. As such FCM based detection of virus-infected cells provides a fast and quantitative recording of fluorescent signals from individual cells [97-99].
In general, FCM based assays for viral particle detection does not provide high sensitivity [89, 90] ; however some of the commercially developed FCM methods (for example, Virus Counter® 2100) offers simple and rapid virus quantifications assay with high sensitivities. When using the virus counter, each sample is stained with two different fluorescent dyes: One specific for nucleic acid and the other specific for the protein. After thirty-minute incubation, the stained sample is analyzed on the virus counter instrument to calculate a concentration of the virus particles (vp/mL).
- Electron microscopy (EM)-grade glutaraldehyde
- Working stain solution of SYBR® green I (10,000× concentrate in DMSO)
- Sterile TE-buffer, pH 8.0
- Ultra-purified water (e.g., Milli-Q water)
- Phosphate buffered saline containing 0.5% BSA (PBSA)
- Liquid N2
- Microcentrifuge tubes
- Sonicator
- Flow cytometer; PASIII (Partec), CyFlow® Space (Partec), Cytomics FC 500, MPL (Beckman Coulter)
- Prepare serial dilutions of the virus: Label 6 sterile microcentrifuge tubes, and add 270 μl PBSA to each tube. Add 30 μl of the virus stock to the first tube, mix, and transfer 30 μl to the second tube. Repeat to make a serial 1:10 dilution of the virus stock to make a dilution series. FCM analysis linearity needs to be established over a viral concentration range of two logs with a lower detection limit at 105 viral particles per ml [94].
- Fixation, staining and analysis of the virus samples: Fix samples with 0.5% glutaraldehyde for 15–30 min at 4°C in the dark. For permeabilization of the samples, first flash freeze samples in liquid N2 (-180 °C) for 1 min, then thaw again, and finally dilute in Tris-EDTA (TE) buffer. Subsequently add 5 μL of 100x diluted (DMSO) SYBR® Green I. Perform staining for 10 min at 80°C in the dark, followed by sonication for 30 sec before analyzing the samples by FCM. Use maximum voltage for the green fluorescence photomultiplier tube (PMT) at which no electronic or laser noise is detected. Control blanks, consisting of TE buffer with autoclaved 0.2-μm-filtered (or 30-kDa ultrafiltered) sample at the same dilution factor as the virus samples, should be used before FCM analysis of the test samples. Blanks are diluted, stained, and processed identically to the samples. Very low coincidence (0–15 events s–1) and background fluorescence levels should be detected from blanks before proceeding with sample analysis. Detailed method to perform FCM has been described here - Labome.
Most viruses are very small to be seen directly under a light microscope, and therefore could only be viewed with TEM (transmission electron microscopy). In 1948, smallpox and chicken pox were first differentiated by TEM [100] and thereafter early virus classifications depended heavily on TEM analysis. In particular many intestinal viruses were discovered by negative staining TEM microscopy [101, 102]. Although TEM has gradually been replaced by more sensitive methods such as the PCR and IFA, nevertheless it still remains essential for several aspects of virology including discovery, description and titration of viruses. One of the major advantages of using TEM is that it does not require virus-specific reagents; this is of particular importance in an outbreak setting where the etiologic agent is unknown and therefore specific reagents may not be available to determine correct detection tests. There is a fine review describing Modern uses of electron microscopy for detection of viruses written by Goldsmith and Miller [4]. As such, negative stained TEM technique continues to be a valuable tool for the discovery and identification of novel viruses including Ebola virus, henipavirus (Hendra and Nipah) and SARS [103-107]. A human monkeypox outbreak was detected in the US by TEM [108]. Another fine review by Roingeard 2008 describes the current status and future prospects for viral detection by TEM [109].

Direct negative stain TEM is a method of choice, if the sample is expected to contain a high count of virus (>107 particles/ml), however, if low titer virus is anticipated, samples can be purified by either sucrose density purification or ultra-centrifugation. Though both of these concentration methods improve overall detection limit to ~105particles/ml, they have some limitations; for instance sucrose can cause damage to extremely labile virus particles, whereas ultracentrifugation might concentrate debris along with virus leading to a reduction of detection limit. Several negative stains protocols have been described, whereas most preferred ones being 0.05 to 2% uranyl acetate, 1 to 2% phosphotungstic acid (PTA), and 0.05 to 5% ammonium molybdate [4]. As such, direct negative stain TEM images can demonstrate individual virus particles and quantitative image analysis can be used to determine virus concentrations. Nevertheless, due to the high instrument cost and the amount of space and facilities required, TEM is still only available in certain facilities.
- Glow discharge apparatus
- EM grid-grade tweezers (2 or more pairs)
- Uranyl acetate
- Ultra-purified water (e.g., Milli-Q water)
- EM grids
- Petri dishes
- A waste container for uranyl acetate
- TEM instrument
Adsorbing Viruses onto TEM Grids: Hold the grid in the tweezers, place 5 μl of viral lysate sample onto the shiny side of the grid and then let the sample adsorb to the EM grids for ~3 minutes. Stain the grid immediately after virus adsorption by staining grid to 3 times with 2% uranyl acetate for 45 seconds each.
Figure 12 shows negative stained large naked icosahedral shaped, adenoviruses [4]. Many atlases, numerous other websites and blogs also demonstrate excellent negative stained virus picture. For instance, virology.net and [110].
Multiple techniques have been developed over the past several decades, in order to quantitatively characterize viral samples. Conventional approaches to quantify infective viral particles are labour-intensive, time-consuming, and often associated with poor reproducibility. Although IFA generally provides quicker results than plaque or TCID 50 assays; however, is quite expensive due to the requirement of antigen-specific antibody. On the other hand, methods for quantifying viral antigens or viral gene expression are generally quicker and reproducible; they often have difficulty for absolute particle counting. Likewise, while qPCR may be able to provide results within a matter of hours, it is laborious, requires a skilled operator, and is sensitive to contamination. TEM-based quantification, although highly accurate in determining the shape and the total number of viral particle, often considered time-consuming, extremely expensive and impractical for high sample numbers. Moreover, TEM sample preparation is tedious, and the technique requires sophisticated instrument and a skilled operator. To alleviate these limitations, there is still a need to develop new cost-effective analytical methods that can allow users to quickly and easily determine virus concentrations and reduce constrictions coupled with current assays. Nevertheless, any such emerging methods must be carefully evaluated in terms of their efficiency, precision and linear range.
- Engelhardt P, Wyder M, Zurbriggen A, Grone A. Canine distemper virus associated proliferation of canine footpad keratinocytes in vitro. Vet Microbiol. 2005;107:1-12 pubmed
- unpublished data.
- Galeno H, Mora J, Villagra E, Fernandez J, Hernandez J, Mertz G, et al. First human isolate of Hantavirus (Andes virus) in the Americas. Emerg Infect Dis. 2002;8:657-61 pubmed
- Calderaro A, Arcangeletti M, Rodighiero I, Buttrini M, Montecchini S, Vasile Simone R, et al. Identification of different respiratory viruses, after a cell culture step, by matrix assisted laser desorption/ionization time of flight mass spectrometry (MALDI-TOF MS). Sci Rep. 2016;6:36082 pubmed publisher
- Enders J. Cytopathology of virus infections: particular reference to tissue culture studies. Annu Rev Microbiol. 1954;8:473-502 pubmed
- Leland D, Ginocchio C. Role of cell culture for virus detection in the age of technology. Clin Microbiol Rev. 2007;20:49-78 pubmed
- Hsiung G. Diagnostic virology: from animals to automation. Yale J Biol Med. 1984;57:727-33 pubmed
- Forman M S, Valsamakis A. Specimen collection, transport, and processing: virology. In: Murray PR, Baron EJ, Jorgensen JH, Pfaller MA, Yolken RH editors. Manual of clinical microbiology. 8th ed. ASM Press: Washington, DC; 2003. AND Smith TF. Specimen requirements: selection, collection, transport, and processing. In: Specter S, Hodinka RL, Young SA editors. Clinical virology manual, 3rd ed. ASM Press: Washington, DC; 2000.
- Gleaves C, Smith T, Shuster E, Pearson G. Rapid detection of cytomegalovirus in MRC-5 cells inoculated with urine specimens by using low-speed centrifugation and monoclonal antibody to an early antigen. J Clin Microbiol. 1984;19:917-9 pubmed
- Rodriguez Roche R, Alvarez M, Guzman M, Morier L, Kouri G. Comparison of rapid centrifugation assay with conventional tissue culture method for isolation of dengue 2 virus in C6/36-HT cells. J Clin Microbiol. 2000;38:3508-10 pubmed
- Espy M, Smith T, Harmon M, Kendal A. Rapid detection of influenza virus by shell vial assay with monoclonal antibodies. J Clin Microbiol. 1986;24:677-9 pubmed
- Navarro Marí J, Sanbonmatsu Gámez S, Pérez Ruiz M, de la Rosa Fraile M. Rapid detection of respiratory viruses by shell vial assay using simultaneous culture of HEp-2, LLC-MK2, and MDCK cells in a single vial. J Clin Microbiol. 1999;37:2346-7 pubmed
- Anestad G. Surveillance of respiratory viral infections by rapid immunofluorescence diagnosis, with emphasis on virus interference. Epidemiol Infect. 1987;99:523-31 pubmed
- Daisy J, Lief F, Friedman H. Rapid diagnosis of influenza A infection by direct immunofluorescence of nasopharyngeal aspirates in adults. J Clin Microbiol. 1979;9:688-92 pubmed
- Fauvel M, Ozanne G. Immunofluorescence assay for human immunodeficiency virus antibody: investigation of cell fixation for virus inactivation and antigen preservation. J Clin Microbiol. 1989;27:1810-3 pubmed
- Klespies S, Cebula D, Kelley C, Galehouse D, Maurer C. Detection of enteroviruses from clinical specimens by spin amplification shell vial culture and monoclonal antibody assay. J Clin Microbiol. 1996;34:1465-7 pubmed
- Coffin S, Hodinka R. Utility of direct immunofluorescence and virus culture for detection of varicella-zoster virus in skin lesions. J Clin Microbiol. 1995;33:2792-5 pubmed
- Pouletty P, Chomel J, Thouvenot D, Catalan F, Rabillon V, Kadouche J. Detection of herpes simplex virus in direct specimens by immunofluorescence assay using a monoclonal antibody. J Clin Microbiol. 1987;25:958-9 pubmed
- Liu I, Chen P, Yeh S, Chiang Y, Huang L, Chang M, et al. Immunofluorescence assay for detection of the nucleocapsid antigen of the severe acute respiratory syndrome (SARS)-associated coronavirus in cells derived from throat wash samples of patients with SARS. J Clin Microbiol. 2005;43:2444-8 pubmed
- Zhang W, Evans D. Detection and identification of human influenza viruses by the polymerase chain reaction. J Virol Methods. 1991;33:165-89 pubmed
- van Elden L, Nijhuis M, Schipper P, Schuurman R, van Loon A. Simultaneous detection of influenza viruses A and B using real-time quantitative PCR. J Clin Microbiol. 2001;39:196-200 pubmed
- Gueudin M, Vabret A, Petitjean J, Gouarin S, Brouard J, Freymuth F. Quantitation of respiratory syncytial virus RNA in nasal aspirates of children by real-time RT-PCR assay. J Virol Methods. 2003;109:39-45 pubmed
- Cooper L, Scott T. Differential evolution of eastern equine encephalitis virus populations in response to host cell type. Genetics. 2001;157:1403-12 pubmed
- López Bueno A, Mateu M, Almendral J. High mutant frequency in populations of a DNA virus allows evasion from antibody therapy in an immunodeficient host. J Virol. 2003;77:2701-8 pubmed
- LaBarre D, Lowy R. Improvements in methods for calculating virus titer estimates from TCID50 and plaque assays. J Virol Methods. 2001;96:107-26 pubmed
- Takenaka A, Gibbs C, Gajdusek D. Antiviral neutralizing antibody to Hantaan virus as determined by plaque reduction technique. Arch Virol. 1985;84:197-206 pubmed
- Dulbecco R. Production of Plaques in Monolayer Tissue Cultures by Single Particles of an Animal Virus. Proc Natl Acad Sci U S A. 1952;38:747-52 pubmed
- Biacchesi S, Skiadopoulos M, Yang L, Murphy B, Collins P, Buchholz U. Rapid human metapneumovirus microneutralization assay based on green fluorescent protein expression. J Virol Methods. 2005;128:192-7 pubmed
- Cromeans T, Sobsey M, Fields H. Development of a plaque assay for a cytopathic, rapidly replicating isolate of hepatitis A virus. J Med Virol. 1987;22:45-56 pubmed
- Payne A, Binduga Gajewska I, Kauffman E, Kramer L. Quantitation of flaviviruses by fluorescent focus assay. J Virol Methods. 2006;134:183-9 pubmed
- Schoepp R, Beaty B. Titration of dengue viruses by immunofluorescence in microtiter plates. J Clin Microbiol. 1984;20:1017-9 pubmed
- Kvinesdal B, Nielsen C, Poulsen A, Højlyng N. Immunofluorescence assay for detection of antibodies to human immunodeficiency virus type 2. J Clin Microbiol. 1989;27:2502-4 pubmed
- Schochetman G, Epstein J, Zuck T. Serodiagnosis of infection with the AIDS virus and other human retroviruses. Annu Rev Microbiol. 1989;43:629-59 pubmed
- Damen M, Zaaijer H, Cuypers H, Vrielink H, van der Poel C, Reesink H, et al. Reliability of the third-generation recombinant immunoblot assay for hepatitis C virus. Transfusion. 1995;35:745-9 pubmed
- Maxwell K, Frappier L. Viral proteomics. Microbiol Mol Biol Rev. 2007;71:398-411 pubmed
- Fontaine Rodriguez E, Taylor T, Olesky M, Knipe D. Proteomics of herpes simplex virus infected cell protein 27: association with translation initiation factors. Virology. 2004;330:487-92 pubmed
- Taylor T, Knipe D. Proteomics of herpes simplex virus replication compartments: association of cellular DNA replication, repair, recombination, and chromatin remodeling proteins with ICP8. J Virol. 2004;78:5856-66 pubmed
- Bernstein J, Hruska J. Respiratory syncytial virus proteins: identification by immunoprecipitation. J Virol. 1981;38:278-85 pubmed
- Waxman L, Whitney M, Pollok B, Kuo L, Darke P. Host cell factor requirement for hepatitis C virus enzyme maturation. Proc Natl Acad Sci U S A. 2001;98:13931-5 pubmed
- Khanna M, Kumar P, Chugh L, Prasad A, Chhabra S. Evaluation of influenza virus detection by direct enzyme immunoassay (EIA) and conventional methods in asthmatic patients. J Commun Dis. 2001;33:163-9 pubmed
- Waner J, Todd S, Shalaby H, Murphy P, Wall L. Comparison of Directigen FLU-A with viral isolation and direct immunofluorescence for the rapid detection and identification of influenza A virus. J Clin Microbiol. 1991;29:479-82 pubmed
- Lee M, Cohen B, Hand J, Nokes D. A simplified and standardized neutralization enzyme immunoassay for the quantification of measles neutralizing antibody. J Virol Methods. 1999;78:209-17 pubmed
- Niu X, Wang X, Liu G, Li Y. [Establishment of the evaluation reference system for domestic anti-hepatitis C virus diagnostic enzyme immunoassay kits]. Xi Bao Yu Fen Zi Mian Yi Xue Za Zhi. 2013;29:761-4 pubmed
- Filice G, Soldini L, Orsolini P, Razzini E, Gulminetti R, Campisi D, et al. Sensitivity and specificity of anti-HIV ELISA employing recombinant (p24, p66, gp120) and synthetic (gp41) viral antigenic peptides. Microbiologica. 1991;14:185-94 pubmed
- de Boer G, Back W, Osterhaus A. An ELISA for detection of antibodies against influenza A nucleoprotein in humans and various animal species. Arch Virol. 1990;115:47-61 pubmed
- Cuzzubbo A, Vaughn D, Nisalak A, Solomon T, Kalayanarooj S, Aaskov J, et al. Comparison of PanBio dengue duo enzyme-linked immunosorbent assay (ELISA) and MRL dengue fever virus immunoglobulin M capture ELISA for diagnosis of dengue virus infections in Southeast Asia. Clin Diagn Lab Immunol. 1999;6:705-12 pubmed
- Hirst G. THE QUANTITATIVE DETERMINATION OF INFLUENZA VIRUS AND ANTIBODIES BY MEANS OF RED CELL AGGLUTINATION. J Exp Med. 1942;75:49-64 pubmed
- DONALD H, Isaacs A. Counts of influenza virus particles. J Gen Microbiol. 1954;10:457-64 pubmed
- Stoffel C, Kathy R, Rowlen K. Design and characterization of a compact dual channel virus counter. Cytometry A. 2005;65:140-7 pubmed
- Brussaard C, Marie D, Bratbak G. Flow cytometric detection of viruses. J Virol Methods. 2000;85:175-82 pubmed
- Marie -, Brussaard -, Thyrhaug -, Bratbak -, Vaulot -. Enumeration of marine viruses in culture and natural samples by flow cytometry. Appl Environ Microbiol. 1999;65:45-52 pubmed
- Chen F, Lu J, Binder B, Liu Y, Hodson R. Application of digital image analysis and flow cytometry to enumerate marine viruses stained with SYBR gold. Appl Environ Microbiol. 2001;67:539-45 pubmed
- Yan X, Zhong W, Tang A, Schielke E, Hang W, Nolan J. Multiplexed flow cytometric immunoassay for influenza virus detection and differentiation. Anal Chem. 2005;77:7673-8 pubmed
- Hwang Y, Chen W, Yates M. Use of fluorescence resonance energy transfer for rapid detection of enteroviral infection in vivo. Appl Environ Microbiol. 2006;72:3710-5 pubmed
- Wunschmann S, Stapleton J. Fluorescence-based quantitative methods for detecting human immunodeficiency virus type 1-induced syncytia. J Clin Microbiol. 2000;38:3055-60 pubmed
- Shen C, Meghrous J, Kamen A. Quantitation of baculovirus particles by flow cytometry. J Virol Methods. 2002;105:321-30 pubmed
- Lambeth C, White L, Johnston R, de Silva A. Flow cytometry-based assay for titrating dengue virus. J Clin Microbiol. 2005;43:3267-72 pubmed
- Kao C, Wu M, Chiu Y, Lin J, Wu Y, Yueh Y, et al. Flow cytometry compared with indirect immunofluorescence for rapid detection of dengue virus type 1 after amplification in tissue culture. J Clin Microbiol. 2001;39:3672-7 pubmed
- Sydow F, Santiago M, Neves Souza P, Cerqueira D, Gouvea A, Lavatori M, et al. Comparison of dengue infection in human mononuclear leukocytes with mosquito C6/36 and mammalian Vero cells using flow cytometry to detect virus antigen. Mem Inst Oswaldo Cruz. 2000;95:483-9 pubmed
- Nagler F, Rake G. The Use of the Electron Microscope in Diagnosis of Variola, Vaccinia, and Varicella. J Bacteriol. 1948;55:45-51 pubmed
- Gust I, Kaldor J, Cross G, Waugh M, Ferris A. Virus-like particles associated with a faecal antigen from hepatitis patients and with Australia antigen. Aust J Exp Biol Med Sci. 1971;49:1-9 pubmed
- Kapikian A, Wyatt R, Dolin R, Thornhill T, Kalica A, Chanock R. Visualization by immune electron microscopy of a 27-nm particle associated with acute infectious nonbacterial gastroenteritis. J Virol. 1972;10:1075-81 pubmed
- Johnson K, Lange J, Webb P, Murphy F. Isolation and partial characterisation of a new virus causing acute haemorrhagic fever in Zaire. Lancet. 1977;1:569-71 pubmed
- Pattyn S, van der Groen G, Jacob W, Piot P, Courteille G. Isolation of Marburg-like virus from a case of haemorrhagic fever in Zaire. Lancet. 1977;1:573-4 pubmed
- Chua K, Wong E, Cropp B, Hyatt A. Role of electron microscopy in Nipah virus outbreak investigation and control. Med J Malaysia. 2007;62:139-42 pubmed
- Hyatt A, Zaki S, Goldsmith C, Wise T, Hengstberger S. Ultrastructure of Hendra virus and Nipah virus within cultured cells and host animals. Microbes Infect. 2001;3:297-306 pubmed
- Drosten C, Gunther S, Preiser W, van der Werf S, Brodt H, Becker S, et al. Identification of a novel coronavirus in patients with severe acute respiratory syndrome. N Engl J Med. 2003;348:1967-76 pubmed
- Reed K, Melski J, Graham M, Regnery R, Sotir M, Wegner M, et al. The detection of monkeypox in humans in the Western Hemisphere. N Engl J Med. 2004;350:342-50 pubmed
- Fauquet, C. M., M. A. Mayo, J. Maniloff, U. Desselberger, and L. A. Ball (ed.). 2005. Virus taxonomy. Classification and nomenclature of viruses. Eighth report of the International Committee on the Taxonomy of Viruses. Elsevier Academic Press, New York, NY.
- Materials and Methods [ISSN : 2329-5139] is a unique online journal with regularly updated review articles on laboratory materials and methods. If you are interested in contributing a manuscript or suggesting a topic, please leave us feedback.
- method
- Antibody Applications
- Cell Culture Media: A Review
- Current PCR Methods
- DNA Extraction and Purification
- Flow Cytometry - A Survey and the Basics
- Flow Cytometry and Cell Sorting: A Practical Guide
- Microscopes in Biomedical Research
- PCR Protocol and Troubleshooting
- RNA-seq
- SARS-CoV-2
- Venereal Diseases
- Western Blot - Protocol, Troubleshooting, and Survey Results on Instruments and Reagents