A comprehensive review of RNA-seq methodologies, including an extensive discussion on single-cell RNA-seq.
Next-generation sequencing is rapidly becoming the method of choice for transcriptional profiling experiments. In contrast to microarray technology, high throughput sequencing allows identification of novel transcripts, does not require a sequenced genome and circumvents background noise associated with fluorescence quantification. Furthermore, unlike hybridization-based detection, RNA-seq allows genome-wide analysis of transcription at single nucleotide resolution, including identification of alternative splicing events and post-transcriptional RNA editing events.
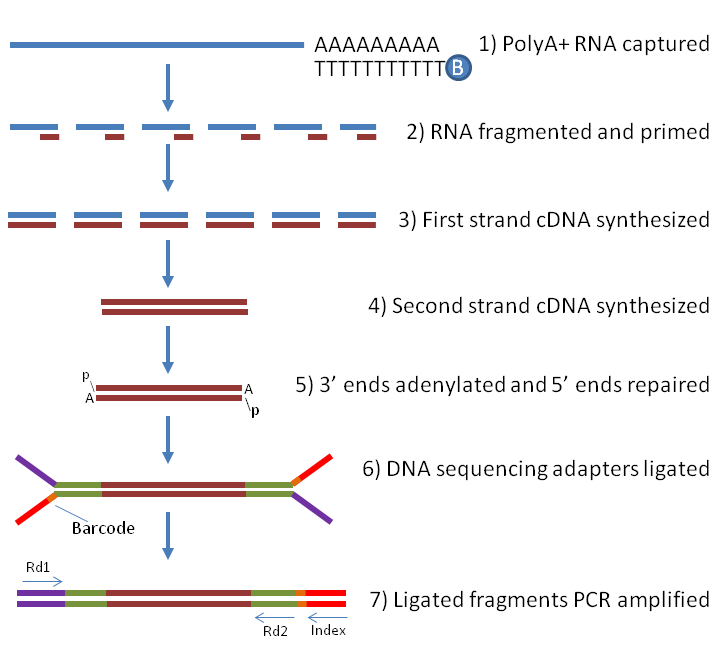
All RNA-seq experiments follow a similar protocol. Total RNA is isolated from a sample of interest which, depending on the type of RNA to be profiled, may be purified to enrich for mRNAs, microRNAs or lincRNAs, etc before preparing an RNA library. Library preparation may involve such steps as reverse transcription to cDNA, PCR amplification and may or may not preserve strandedness information. Sequencing can produce one read in a single-end sequencing reaction, or two ends separated by an unsequenced fragment in paired-end reactions. Together, RNA-seq has allowed an unparalleled view of the transcriptome in normal and pathological processes and has revealed that the transcriptome is significantly more complex than previously envisioned [1].
This review will examine planning, performing and analyzing an RNA-Seq experiment. Briefly, this includes determining optimal sequencing depth, number of replicates, and choosing a sequencing platform; preparing and sequencing libraries; and mapping of reads to a genome followed by transcript quantification. Each of these steps will be reviewed in turn. Moreover, a final section on single-cell RNA sequencing (scRNA-seq), which has been shown to be a powerful technique for potentially mapping genotypes to phenotypes, is included. However, let us first review the main advantages and disadvantages, as well as similarities, of RNA-seq, compared to microarrays in greater detail.

Microarray-based analysis of the transcriptome is responsible for a great deal of our current understanding of spatiotemporal-specific gene expression in development and disease. Ignoring the fact that microarray analysis is limited to organisms with sequenced genomes and detection of known transcripts, hybridization-based detection can suffer from some inherent weaknesses, such as poor sensitivity, low specificity, and a limited dynamic range. RNA-seq reduces, and in some cases eliminates, these limitations [2]. With sufficient sequencing depth, the dynamic range is infinite. Non-specific hybridization or cross-hybridization is a common concern when interpreting microarrays, especially when closely related gene family members with highly similar sequence are of particular interest. In this regard, RNA-seq largely eliminates the ambiguity of sequence detection but at the cost of potential ambiguity in the mapping of reads to the genome, since a sequenced read may map to multiple locations. The added information of a second read sequence and prior knowledge of the expected distance between each read allow more accurate mapping.
While not suffering from some of the disadvantages of hybridization-based detection, some biases unique to high throughput sequencing have been identified. One of the first steps of mRNA library preparation is RNA fragmentation to smaller pieces to allow sequencing. This may be done by Covaris sonication or RNase III enzymatic digestion, but the use of divalent cations under elevated temperature is most common. All methods introduce bias which can be position- and/or sequence content-based [3].

Currently, all commercially available RNA-seq platforms rely on reverse transcription and PCR amplification prior to sequencing and sequencing is therefore subject to the biases inherent to these procedures. First, annealing of random hexamer primers to fragmented RNA is not random, which results in depletion of reads at both 5’ and 3’ ends [3-6]

This makes the identification of the true start and end of novel transcripts a challenge, as well as underestimating expression level of short genes. Second, PCR can introduce bias based on GC content and length due to non-linear amplification [7, 8]. A number of data analysis tools to correct these biases are available, although achieving varying degrees of success [6, 9, 10]. Given that the total number of reads per transcript is proportional to the level of a transcript multiplied by transcript length, a long transcript will be sequenced more often than a short transcript when expressed at equivalent levels. Since statistical power is closely linked to sample size, a long transcript is more likely to be found differentially expressed than a short transcript [11]. To mitigate this problem, expression levels are frequently expressed by calculating the number of reads or fragments per kilobase per million reads (RPKM and FPKM, respectively) [1]. The FPKM transformation also allows direct comparison of transcript expression between two libraries with different sequencing depth as well as an indication of relative expression levels between two or more transcripts in a single library.
The next generation sequencing platforms most frequently used for RNA-seq are the Illumina HiSeq (4000 [12], 2500 [13, 14] ), Ion Torrent, and SOLiD systems. Whilst the library preparation and nucleotide detection protocols for each platform vary, all consist of the following main steps:
Depending on class of RNA to be sequenced (i.e. mRNA, lincRNA, microRNA etc), enrichment is performed. Good quality total RNA is critical, although alternative protocols for degraded RNA exist [15].
Library preparation can be accomplished through commercial kits such as the NEXTflex kit from Bioo Scientific) [13], SMARTer Stranded RNA-Seq Kits from Takara (634837) [16] or SMART-Seq® v4 Ultra® Low Input RNA Kit from Takara (634890) [17], Nextera XT DNA Library Prep Kit from Illumina (FC-131-1096) [18], TruSeq from Illumina [19, 20], Ovation SoLo kit from NuGEN (0501-32) [21], or their variants [14, 22]. Library preparation consists of:
Unlike short RNAs, mRNAs are typically fragmented to smaller pieces of RNA to enable sequencing.
First and second strand cDNA is reverse transcribed from fragmented RNA using random hexamers or oligo(dT) primers.
The 5’ and/or 3’ ends of cDNA are repaired, and adapters (containing sequences to allow hybridization to a flow cell) are ligated.
Libraries are enriched for correctly ligated cDNA fragments and amplified by PCR to add any remaining sequencing primer sequences.
Library concentration is assessed using qRT-PCR and/or Bioanalyzer, for example, Agilent Bioanalyzer 2100 [23], and is ready for sequencing.
Downstream data analysis consists of quality control such as trimming of sequencing adapters and removal of reads with poor quality scores followed by mapping reads, analysis of differential expression, identification of novel transcripts and pathway analysis.
Just as for any other technique, a well-designed RNA-seq experiment consists of proper replication, randomization and blocking [24]. An all too common topic on Internet NGS user forums, such as Seqanswers (http://www.seqanswers.com/), is how to identify statistically significant differential gene expression from an experiment without replicates. Although it is technically possible to calculate DGE without replicates, these experiments must be interpreted with extreme caution. Unless one is purely concerned with novel transcript discovery, both technical and biological replicates must be carefully considered from the outset. In the infancy of RNA-seq, technical replicates (libraries prepared from the same RNA sample) were commonly used. However, it has been shown that biological variation far outweighs technical variation, at least when coverage of at least 5 reads/nucleotide is obtained [25, 26]. Technical replicates, therefore, are most useful when the goal is to compare the performance of two or more competing sequencing technologies. If the goal is to investigate differences between treatments biological replication is essential in order to generalize the results to a larger population. The required number of replicates will vary greatly depending on the amount of biological variability associated with the samples of interest and should be empirically determined. To this end, the number of replicates used for any prior microarray analysis is usually a good starting point.
Most sequencing platforms support multiplexing of libraries by introducing barcodes during library preparation. This allows simultaneous sequencing of multiple libraries in a single sequencing run thereby enabling more efficient use of a sequencer machine. Importantly, multiplexing also facilitates a balanced block design to minimize potential confounding factors such as PCR amplification and flow cell effects [24, 27]. Consider an example where three placebo-treated samples and an equal number of drug-treated samples are to be sequenced on an Illumina HiSeq 2000 or 4000 instrument. The Illumina HiSeq uses a flow cell with eight lanes, one of which is usually reserved for a PhiX sequencing control used for quality control purposes. Rather than use a single lane per sample, all six libraries should be barcoded during library preparation to allow all libraries to be simultaneously sequenced over six lanes. Reads are demultiplexed following sequencing based upon barcode sequence and analyzed accordingly. Such a design offers insurance against one poor sequencing lane compromising the study. On the other hand, if an unblocked design was used and one lane was to have unacceptably strong artifacts, an entire sample would be lost, and the study compromised. As an example, Garrett-Bakelman FE et al used the NEBNext® Multiplex Oligos for Illumina® (96 Index Primers) barcode plate (E6609S) and standard barcodes (#10-15, 18-23, 27-28 from Multiplex Oligos for Illumina® Index Primers Sets 1,2,3 (E7335S,E7500S,E7710S)) for both ribodepleted and polyA RNA-seq library preparation [12].
While offering the major advantage of removing confounding factors, a multiplexed, balanced block design also allows for re-sequencing on an additional lane(s) at a later date to increase the number reads as needed, without introducing sample-specific biases from flow cell to flow cell variation. Determining the “correct” number of sequencing reads per sample is a challenging problem that is subject to vigorous debate. When profiling the chicken transcriptome, Wang et al showed that 30 million reads are sufficient to obtain a reliable measurement of all genes in the genome, whereas 10 million allows detection of 80% of genes [28]. Supporting a lower number of reads as optimal for transcriptional profiling, Tarazona et al report that increased sequencing depth results in more false positives due to increased noise [29]. Others, including the ENCODE consortium, propose that between 100-200 million reads per sample or greater are required, especially when novel transcripts or splicing events are of particular interest. Clearly, the issue of sequencing depth is a rapidly evolving issue without a clear consensus.
Further complicating the matter is the great deal of inter-species variation in transcriptome size. Sequencing a bacterial transcriptome will require far fewer reads than needed for a vertebrate transcriptome [30]. However, estimating transcriptome size is problematic since genome size and transcriptome size are imperfectly correlated, and estimating transcriptome size is especially tricky for non-model organisms without a sequenced genome. For example, the genome of the laboratory mouse is 2.6 Gb and encodes ~ 25,000 protein-coding genes, whereas a similar number of genes are encoded in the 1 Gb chicken genome. Therefore, efforts to sequence the transcriptome of non-model organisms will particularly benefit from a small pilot study to empirically determine adequate sequencing depth [31]. When alternative splicing is of greater interest, obtaining paired-end sequence data can be more valuable than increasing number of reads, due to the increased probability of a splice junction falling within or between the sequenced ends [32]. An additional advantage of paired-end RNA-seq is the opportunity to detect chimeric transcripts resulting from gene fusion events [33]. Furthermore, obtaining paired-end sequence reads allow greater certainty when an individual read can be mapped to multiple loci on the genome, particularly in repetitive regions.
An online tool called Scotty allows users to design optimal sequencing depth and the number of biological replicates whilst simultaneously satisfying user-defined inputs such as maximum cost and required statistical power [34]. When calculating the required sequencing depth, one should bear in mind the potential for loss of reads to undesired RNA species, chiefly ribosomal RNA (rRNA), as well as reads that are unable to be mapped, since both factors can decrease the number of useable reads for downstream analysis by as much as 60-80%. A number of hybridization-based rRNA depletion approaches have been developed to enrich for less abundant species of RNA. (rRNA depletion is discussed in detail in a section below). Broadly, enrichment strategies either deplete rRNA or allow positive selection for mRNA. For eukaryote transcriptome analysis using SOLiD or Ion Torrent platforms, polyA+ selection can optionally be performed prior to library construction using either magnetic bead-conjugated oligo(dT) oligonucleotides (Dynabeads; Life Technologies) or immobilized oligo(dT) capture probes (mRNA Catcher PLUS; Life Technologies), for example. (PolyA+ selection is discussed in detailin a section below). On the other hand, Illumina TruSeq libraries utilize two rounds of magnetic bead-conjugated oligo(dT) capture for polyA+ selection, with the final polyA+ elution step also serving to fragment and prime RNA for downstream cDNA synthesis. During polyA+ enrichment for polyadenylated mRNAs, non-polyadenylated RNA species, including microRNAs, lincRNAs and other macro ncRNAs are depleted and not represented in the resulting libraries. In contrast, rRNA depletion strategies have been shown to preserve these RNA species [4, 35]. Two of the most frequently used rRNA depletion methods are RiboMinus (Life Technologies) and Ribo-Zero (Epicentre or Illumina) [17, 36]. Both methods utilize a pool of rRNA capture probes followed by spin column or magnetic bead-based collection of the non-rRNA fraction. rRNA capture probes for multicellular eukaryotes (human/mouse compatibility) as well as microorganisms (yeast/bacteria) are available from both vendors. Ribo-Minus may offer the extra advantage in removing mitochondrial rRNA as well as cytoplasmic rRNA [4]. Finally, rRNA depletion should be the method of choice when sequencing degraded RNA isolates from formalin-fixed paraffin-embedded samples since polyA+ selection methods assume the availability of high-quality total RNA to enable isolation of full-length transcripts [15]. NEBNext® Ultra™ II Directional RNA Library Prep Kit is a popular choice for RNA purification [12, 37].
Just as rRNA contamination will significantly reduce the number of reads mapping to mRNA, so will highly expressed mRNAs, such as housekeeping genes, reduce the number of reads mapping to weakly expressed genes. For example, 75% of reads from a human mammary epithelial cell line library map to the most abundant 7% of the transcriptome [38]. Clearly, when the number of reads is at a premium, it would be most useful to have them map to regions of interest. To remove transcripts corresponding to a small number of housekeeping genes, Epicentre extended the Ribo-Zero concept by designing capture oligos to remove globin mRNAs. Exome capture microarrays may also be used to increase sensitivity, although at the cost of reduced quantification accuracy [39]. In contrast, the Rinn laboratory developed RNA CaptureSeq to specifically sequence weakly expressed regions of the transcriptome [40]. Briefly, RNA is hybridized to tiling microarrays containing probes corresponding to genomic regions of interest and the captured RNAs eluted and sequenced. CaptureSeq allowed ~380-fold enrichment of reads mapping to targeted regions of the transcriptome compared to conventional RNA-seq without capture. Although conventionally used for exome sequencing or targeted re-sequencing of DNA, Levin et al used microarrays to capture 467 cancer-related genes for targeted RNA sequencing [41]. This approach allowed identification of mutations and fusion transcripts while largely preserving transcript abundance. An important caveat, however, is that inferring a somatic DNA mutation by cDNA sequencing is problematic without careful validation by Sanger sequencing due to extensive RNA editing [42]. Most recently, Life Technologies released a targeted RNA-seq workflow to enable targeted sequencing of over 6000 RNAs, and Illumina is planning to release an equivalent workflow soon. Although based on the sequencing of short PCR-amplified amplicons, not full-length transcripts of targeted RNAs, directed sequencing will provide comparable information to quantitative RT-PCR.
The three most widely used NGS platforms for RNA-seq are SOLiD and Ion Torrent, both marketed by ThermoFisher, and Illumina’s HiSeq. All three platforms have similar sample input requirements and sequences millions of cDNA fragments per run. Below, sample preparation and pertinent application-specific advantages and disadvantages are discussed.
Illumina and Ion Torrent both sequence using a “sequencing by synthesis” (SBS) approach, whereby incorporation of dNTPs is detected simultaneously at millions of fixed positions on a flow cell [43] (Figure 4).
For Illumina, once TruSeq RNA-seq libraries have been prepared, they are hybridized to a flow cell which contains a lawn of covalently bound oligonucleotides complementary to the sequencing adapters that were introduced during library preparation. Once hybridized, the capture oligonucleotide primes DNA polymerase extension activity resulting in a covalently bound full-length complementary copy of the cDNA fragment that is subjected to several rounds of PCR amplification to produce discrete clones ~ 1 μm in diameter that can be optically resolved during sequencing. Obtaining optimal cluster density is critical since it will determine the number of reads obtained. Clearly, low density will result in fewer than expected reads, but over-clustering can be just as problematic since dense flow cells are difficult to analyze and to obtain accurate base calling due to interference and overlap between adjacent clusters. Therefore, accurate quantification of each library using quantitative PCR is an important aspect of library quality control.
In the case of Illumina SBS, all four dNTPs are fluorescently labeled and concurrently introduced on to the flow cell (Figure 5A).
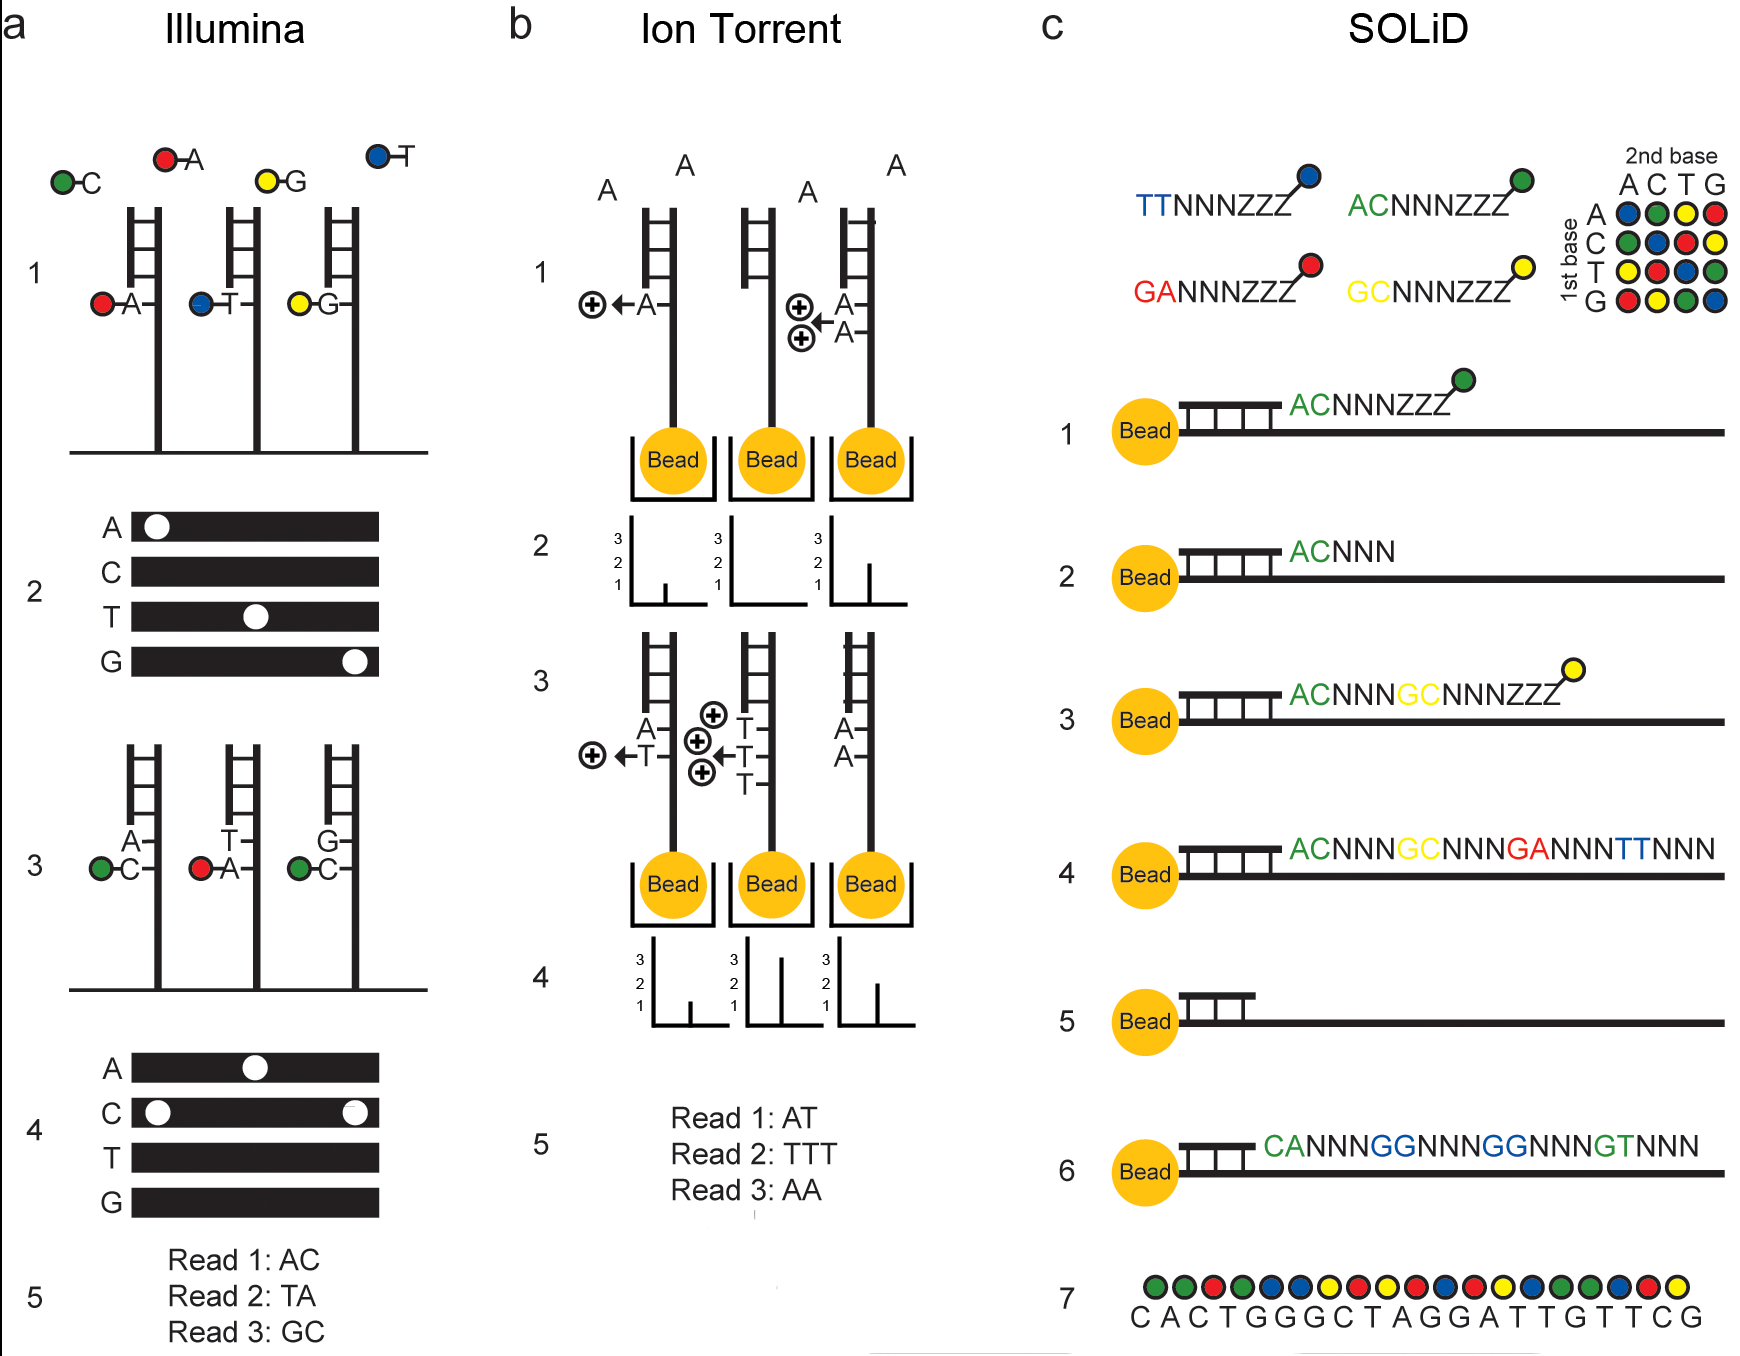
Since all four dNTPs are present, natural competition for binding between dNTPs minimizes incorporation biases. SBS proceeds through multiple cycles of nucleotide incorporation and detection. Importantly, only one nucleotide is incorporated per cycle by use of reversibly terminated dNTPs. After nucleotide incorporation is detected by fluorescence, the fluorophore is removed resulting in regeneration of a 3’ hydroxyl group which allows incorporation of the next dNTP in the subsequent cycle. Importantly, this reversible terminator chemistry allows sequencing of homopolymeric regions, such as “AAAAAA,” with high confidence.
During base calling, fluorescence intensity values for each nucleotide are converted to nucleotide identity using a cross-talk matrix which controls for spectral overlap. Since spectral overlap is determined during the first four cycles, it is imperative that approximately equal numbers of each base be present (i.e., to have a balanced library). Therefore, it is especially important to use barcodes that are well balanced to ensure accurate demultiplexing after sequencing. Likewise, use of a dedicated PhiX control lane to estimate correct spectral overlap is strongly recommended when sequencing unbalanced libraries of AT- or GC-rich genomes [44]. Error rate (incorporation of the incorrect nucleotide) progressively mounts with an increasing number of cycles; currently, up to 150 cycles are supported with an overall error rate of 0.2% [45].
In the first iteration of Illumina sequencing technology, sequencing of only one end of each cDNA fragment was supported. While nevertheless a very powerful tool, in recent years the use of paired-end sequencing is most frequently used when sequencing the transcriptome. In this case, since the flow cell contains randomly arrayed capture oligos complementary to the 5’ and 3’ sequencing adapters, during the “bridge amplification” PCR step, cDNA fragments captured by their 5’ adapters are susceptible to be captured by 3’ capture oligos. This allows for a first sequencing run of up to 150 cycles using the 5’ sequencing primer to be followed by a second sequencing run using the 3’ primer to obtain a total of 300 nt of sequence per fragment. Importantly, several third-party library preparation kits are commercially available that have advantages for certain experiments, for example, Smart-seq [46] reduces the required input to as little as 100 pg total RNA,
Whereas Illumina sequencing and cluster generation relies on solid-phase PCR amplification, emulsion PCR is used to prepare Ion Torrent libraries for sequencing. First, the library template is prepared from fragmented RNA. Unlike Illumina, the standard library protocol is strand-specific by default (Figure 6). Next, beads with complementary oligonucleotides are mixed with PCR reagents and a dilute solution of cDNA library and oil added to make an emulsion. Ideally, each microdroplet of emulsion will contain one bead and one cDNA fragment along with PCR reagents to allow for clonal amplification. Following 16-18 cycles of PCR the emulsion is then broken by organic extraction, beads purified and loaded on to a disposable semiconductor sequencing chip. The sequencing chip is modeled similar to a honeycomb, in that one bead fits into one of hundreds of millions of tiny wells that serve as microreactors during sequencing, each with their own detector. Unlike Illumina’s fluorescence-based SBS, Ion Torrent determines sequence identity by detecting pH alterations due to hydrogen ion release following nucleotide incorporation (Figure 5B). Since the dNTPs are not differentially labeled by a fluorophore, they must be added successively so that ion release can be associated with a particular nucleotide. Since Ion Torrent sequencing isn’t reliant on optical detection of dNTP incorporation, sequencing reactions are much faster, and the number of reads obtainable per sequencing run has been rapidly increasing. However, whereas Illumina makes use of reversible terminator chemistry to restrict dNTP incorporation to once per cycle and sequence through homopolymers, Ion Torrent relies on the number of hydrogen ions released as being proportional to the number of dNTPs incorporated. Therefore, “A” can easily be distinguished from “AA” by a detecting a doubling in the number of hydrogen ions released. However, distinguishing between a run of 7 and 8 adenosines is far more challenging, and consequently, the error rate is high (1.7%) [45].

Ion Torrent and SOLiD RNA libraries preparation share the same molecular biology (Figure 6), although the adapter sequences are different. In contrast to Illumina/Ion Torrent, SOLiD uses a “sequencing by ligation” approach to obtain billions of reads per sequencing run, each up to 75 bp in length. First, emulsion PCR is performed, and beads containing clonally amplified cDNA fragments are attached to the surface of a sequencing flow cell. Sequencing takes place during several rounds of ligation reactions. In the first round, a sequencing primer is annealed, and a mixture of 16 fluorescently labeled 8-mer oligonucleotides added (Figure 5C). The 16 oligonucleotides represent all possible combinations of the first two nucleotides (AC, AG, AT, etc), whereas bases 3-5 are degenerate and unknown. The final three 3’ bases are conjugated to one of four fluorescent labels, each with different excitation and emission spectrum. Therefore, each fluorophore represents four dinucleotides and in each ligation reaction, the identity of only the first two nucleotides is interrogated. As a result, after one round of ligation, the identity of these two bases is narrowed down but not known. To determine their true identity, the original primer and ligated oligos are removed and a second, n-1, primer annealed and a new round of ligation is performed. By combining knowledge from two rounds of interrogation, the identity of the first base is confirmed. The identity of the next base is confirmed using an n-2 primer, and so forth until an n-4 primer is used. In practice, the final three 3’ bases of each 8-mer oligonucleotide are cleaved after each ligation to remove the fluorophore and provide a 5’ phosphate for a second ligation reaction. After 5-7 cycles of ligation, fluorophore detection and fluorophore cleavage, a “reset” is performed and the next primer (i.e. n-1) is used for another 5-7 cycles. SOLiD sequencing, therefore, has the advantage of interrogating each nucleotide twice and accordingly, has reduced errors (<0.1%) during base calling but at the cost of shorter reads length.
Until now, this review has largely focused on identification and quantification of the small proportion of the transcriptome that has coding potential. However, RNA-Seq has been applied to study non-coding RNAs, such as microRNAs and lincRNAs, and even used to discover a new class of non-coding circular transcripts (circRNAs) [47-49]. To gain a complete picture of the transcriptome, biologists may combine coding and non-coding RNA-seq data. In terms of experimental design and sequencing chemistry, the sequencing requirements for non-coding RNA-seq are mostly the same as mRNA-seq.
MicroRNAs (miRNAs) are short pieces of RNA which direct post-transcriptional gene silencing of their targets by imperfect hybridization to the 3’ UTRs of mRNAs. Mature miRNAs are typically 19-24 nt in size and are generated by two cleavage events; first cleavage of a nuclear primary transcript, which may be up to several kilobases in length, and secondly cleavage of the cytoplasmic intermediate hairpin precursor that is approximately 70 nt [50]. Due to rapid processing and turnover, precursor transcripts are sequenced infrequently, and most attention has been paid to the mature form. However, identical protocols have been successfully used to sequence precursor and mature miRNAs [51]. In contrast to Sanger sequencing, which identified only the most strongly expressed miRNAs, NGS can identify weakly expressed miRNAs as well as reveal heterogeneity in length and sequence [52].
As for mRNA-seq, obtaining a good miRNA-seq library begins with obtaining good quality total RNA. It is crucial that the RNA isolation procedure preserve the integrity of small RNAs. Indeed, it was largely due to the fact that frequently used spin columns did not retain RNAs < 200 nt that hindered their discovery. Careful work from the Kim laboratory has shown that although Trizol retains small RNAs, it is a poor choice when a low number of cells are used as starting material since miRNAs with low GC content are selectively depleted [53]. Short RNA sequencing is not restricted to miRNAs; piwi-interacting RNAs (piRNAs) were also identified and characterized using RNA-seq [54]. Except for fragmentation, which is omitted, the stages involved in small RNA library preparation are similar to conventional RNA-seq (Figure 7). The latest version of Illumina miRNA library preparation makes use of a 5’ monophosphate and 3’ hydroxyl groups to specifically ligate miRNAs in a reaction containing total RNA [55], whereas short RNA enrichment by polyacrylamide gel electrophoresis or magnetic bead purification is required or strongly suggested for Ion Torrent and SOLiD libraries. Following RNA adapter ligation, miRNAs are reverse transcribed, amplified by PCR and sequenced. A number of miRNA-focused analysis platforms are freely available [52]. Briefly, reads should be trimmed of barcode and adapter sequences and mapped, either to known miRNAs in miRBase [56] or to a reference genome for novel miRNA discovery. In contrast to the mapping of mRNA-seq data, using a splicing-aware aligner is not necessary, and BWA [57] or Bowtie [58] may be used.

Like miRNAs, lincRNAs make up part of the non-coding assortment of RNAs within eukaryotic cells, although their function is more heterogeneous and less well defined compared to miRNAs [59, 60]. With regards to the sequencing of lincRNAs, paired-end RNA-seq is typically most useful [61, 62]. However, since lincRNAs are frequently antisense to known genes, it is important to know the strandedness of mapped reads, which cannot be known using conventional library preparation methods. To maintain strandedness, either the 5’ and 3’ adapter sequences must be unique, or the first/second cDNA strand biochemically marked during library preparation, typically by substituting dUTP for dTTP to enable UDG-mediated degradation of dUTP-containing DNA [63]. LincRNAs are represented in RNA-seq libraries previously subjected to polyA selection, although omitting this step may allow identification of additional RNAs [61]. Identification of novel lincRNAs is performed computationally by performing ab initio transcriptome reconstruction in combination with consideration for epigenetic markers of active transcription as previously described [60, 64]. Likewise, identification of circRNA transcripts was made computationally by searching for exon scrambling in paired-end RiboMinus RNA-seq data [48].
While not a class of non-coding genes in of itself, the polyA tails of mRNA transcripts are not translated to protein. Following RNA polymerase II-dependent transcription of most mRNAs, a stretch of untemplated adenosine monophosphates is added to the transcript following cleavage by cleavage and polyadenylation specificity factor (CPSF) and poly(A) polymerase. A long-standing question has been the relationship between polyA tail length, transcript stability, and translatability. However, owing to the difficulty to sequence through homopolymeric (< 50 nt of consecutive adenosines) regions, by both Sanger and next-generation sequencing, this question has only been indirectly studied. However, a recent innovative approach to use a combination of sequencing technologies and complex statistical analysis by the Kim laboratory has provided much insight [65]. In their method, called TAIL-seq, total RNA is first depleted of rRNAs and small ncRNAs and a biotinylated 3’ adapter ligated to the remaining mRNAs and long non-coding RNAs. Next, the nuclease RNase T1, which at low concentration specifically cuts after G residues (and not within polyA tails), is incubated with the ligated RNAs followed by pull-down with streptavidin beads to enrich for 3’ adapter ligated RNA fragments. Following 5’ adapter ligation, reverse transcription and PCR amplification, libraries are sequenced from both ends. The first read provides 51 nt of sequence identification for mapping purposes, while the second read, up to 231 nt in length, provides tail length as indicated by a stretch of thymine nucleotides (corresponding to the pre-reverse transcription polyA tail). Despite sequencing libraries on the Illumina platform which is better suited to sequencing homopolymeric regions, incomplete cleavage of the thymine reversible terminator fluorophores results in persisting thymine fluorescence signal in subsequent cycles, making non-poly(T) nucleotides largely indistinguishable from true poly(T) stretches. However, the transition from poly(T) to non-poly(T) stretches was accompanied by an increase in non-T signal. By using a Gaussian mixture hidden Markov model to detect the position of this transition poly(A) tail length can be measured with extraordinary resolution and accuracy and at a genome-wide scale. Ultimately, this technique revealed that tail length correlates with mRNA half-life, but not translational efficiency. Furthermore, TAIL-seq for the first time identified widespread uridylation and guanylation of mammalian mRNAs.
RNA-Seq has become a common method for transcriptomic analysis at single cell level, usually with the 10x Genomics platform [66, 67]. The accompanying reagent kits like Chromium Next GEM Single Cell 3′ Reagent kit [16, 68], Chromium Single Cell 5′ Reagent kit greatly simplify the process [69, 70]. One of the main challenge in single-cell (sc)RNA-seq is the barcoding (or indexing) step. Several new technologies have been introduced for this purpose, for example, single-cell EU-labeled RNA sequencing (scEU-seq) [71] or molecular crowding SCRB-seq (mcSCRB-seq) [72, 73]. Lately, a new method for labelling the transcriptomes of single cells has been presented named single cell combinatorial indexing (sci) applied to scRNA-seq (sci-RNA-seq) [74]. This method includes the following steps: 1- Nuclei are extracted with or without methanol fixation and distributed into 96- or 384-well plate; 2- mRNA is retro-transcribed into the first cDNA strand with poly(T) primers containing unique molecular identifiers (UMIs) introducing the first level of indexing at single cell level; 3- All the cells are pooled and reallocated via FACS sorting into 96- or 384-well plate (e.g., 10 to 100 cells per well); 4- The second cDNA strand is synthesized, a tag called transposon 5 (Tn5) is added by transposase and the cDNA amplified by PCR. During the cDNA amplification, the primers target the first barcode on one end and the Tn5 adaptor on the other end and introduce a second barcode which is specific to each well of the PCR plate; 5- All the amplicons are pooled and then subjected to sequencing. Since each nucleus is characterised by two specific barcodes, mRNA profiling of individual cells can be performed.
An additional method recently introduced is called sci-CAR, a combinatorial indexing based co-assay which profiles single-cell chromatin accessibility and mRNA (CAR) [75]. This method combines the Assay for Transposase-Accessible Chromatin using sequencing (ATAC-seq) and sci-RNA-seq which has been explained above. After the first cDNA strand is synthesized, using the Tn5 transposase, a first ATAC-seq index is introduced. The steps after are similar to the ones described above. In the end, both amplicons from ATAC-seq and RNA-seq are pooled and sequenced. Since each ATAC-seq and RNA-seq libraries are tagged with unique barcodes which correspond to specific wells, the mRNA and chromatin accessibility for single cells can be linked and studied.
Latest advances in droplet microfluidic system have introduced good methods for barcoding single cells. Nonetheless, indexing errors can occur during the cell being encapsulated in the droplet microfluidics. For instance, random encapsulation of cells into a droplet can occur which can cause errors in the cell indexing. Thus, more platforms have been developed in order to reach a precise and efficient expression profiling of single cells during scRNA-seq. For instance, Moon et al [76] have proposed a new droplet-microfluidics system for precise barcoding. The system is based on a spiral system where highly concentrated beads which contain the barcoded oligonucleotides are ordered linearly by an inertial effect and then encapsulated one by one into the droplets avoiding multiple beads into a droplet. As a consequence, the researchers showed a decrease in the barcoding system errors.
To avoid the encapsulation step, Rosenberg et al at Washington University [77] have developed a different method called split-pool ligation transcriptome sequencing (SPLiT-seq) which tags the cellular origin of RNA via a combinatorial barcoding system. The advantage of this system is that it does not require encapsulation steps into droplets, micro-wells or wells but it uses the cells themselves as compartments. In SPLiT-seq single cell-individual transcripts are uniquely labeled via four rounds of combinatorial barcoding: 1- Cells are divided into a 96-well plate, cDNA is generated using well-specific barcoded primers; 2- Cells from all the wells are pooled and re-divided into a new 96-well plate where a second barcode is added to the cDNA; 3- The cells are then again pooled, divided, and a UMI is added through ligation; 4- The last barcode is added to cDNA by PCR during the sequencing preparation. This combinatorial indexing has the advantage to uniquely label over one million cells by generating 21,233,664 barcode combinations for a 96-well plate.
Finally, a further alternative to the droplet-based techniques has been presented by Gierahn et al [78]. They developed a Seq-Well methodology based on a nanowell-based system. Seq-Well puts single cells and barcoded poly(dT) mRNA capture beads in an array of around 86,000 subnanoliter wells through a semi-permeable membrane which allows proficient cell lysis and transcript capture. After cell lysis, mRNA is captured by the beads that also contain a cell barcode and a UMI. Subsequently, the membrane and beads are removed allowing bulk reverse transcription, amplification and library preparation for sequencing. More recently, Butler A et al devised an analytical strategy for integrating single-cell transcriptomic data across different conditions, technologies, and species to identify shared cell populations [79].
J Ding et al systematically compared seven scRNA-seq methods: Smart-seq2, CEL-Seq2, 10x Chromium, Drop-seq [80], SeqWell, inDrops and sci-RNA-seq with three types of samples: a mixture of human and mouse cell lines, human peripheral blood mononuclear cells and mouse cortex nuclei and found that 10x Chromium had the best performance [81]. E Mereu et al benchmarked 13 different scRNA-seq protocols: Quartz-seq2, Chromium, Smart-seq2, CEL-seq2, C1HT-medium, C1HT-small, ddSEQ, Drop-seq, inDrop, ICELL8, MARS-seq and gmcSCRB-seq with a reference sample containing human peripheral blood mononuclear cells, mouse colon cells. HEK293T cells, NIH3T3 cells, and MDCK cells and found that Quartz-seq2 displayed achieved the highest benchmarking score, followed by Chromium, Smart-seq2 and CEL-seq2 [82].
All of the previous steps – experimental design, isolation of RNA and preparation of libraries – firmly reside within the skill set of the traditional wet lab biologist. In contrast, biologists may be less familiar with the techniques and approaches to analyze the resulting RNA-seq data. One of the first challenges new RNA-seq researchers will face is the “data deluge” problem: the compressed single-end sequencing data from one flow cell of an Illumina HiSeq 2500 might be 20 GB and twice as large once uncompressed to allow for processing and manipulation. Learning to handle and manipulate these large files will be one of the first tasks for the novice bioinformatician. Fortunately, there are a wealth of tools which have been generated by biostatisticians and computational scientists to allow biologists to handle, manipulate and understand their RNA-seq data. These tools are split into two groups. Researchers wishing to answer a relatively simple question, such as identifying genes differentially expressed between a cohort of mutants and controls, may consider commercial tools such as those offered by CLC bio (http://www.clcbio.com/) and Partek (http://www.partek.com/). The main advantages of these proprietary tools are the user-friendly, one-step means of obtaining differentially expressed genes, etc, with a dedicated technical support team for assistance with troubleshooting and data interpretation. However, given their proprietary nature, it can be difficult to fully understand and evaluate the assumptions being made during each step of the analysis. For this reason, these tools will not be reviewed any further here. Instead, the remainder of this review will focus on the second group of tools which are open source and developed, supported and published by the scientific community in the spirit of collaboration and openness. While the majority of such tools are run using the command line which might be daunting to the novice, a number of active mailing lists and online support forums exist and are excellent sources of information for beginners and advanced users alike (Appendix).
Obtaining even the most cursory understanding of the command line interface, shell commands, and scripting will increase the productivity and efficiency of researchers tremendously. However, to aid the beginner and streamline analyses, a number of popular command line RNA-seq analysis tools have been implemented in an open, web-based platform such as Galaxy [83-85] and GeneProf [86]. Manipulating RNA-seq data is computationally intensive and typically requires access to a powerful cluster resource. In many cases, access to these computational resources can be obtained through institutional sequencing/genomic core facilities, and a local instance of Galaxy can be installed. An excellent series of step-by-step video tutorials for typical workflows are also provided on the Galaxy website.
| Feature/Tools | NGS QC Toolkit v2.2 | FastQC v0.10.0 | PRINSEQ lite v0.171 | TagDust | FASTX Toolkit v0.0.13 | SolexaQA v1.10 | TagCleaner v0.121 | CANGS v1.1 |
|---|---|---|---|---|---|---|---|---|
| Supported NGS platforms | Illumina, 4542 | Illumina, 454 | Illumina, 454 | Illumina, 454 | Illumina | Illumina | Illumina, 454 | 454 |
| Parallelization | Yes | Yes | No | No | No | No | No | No |
| Detection of FASTQ variants | Yes | Yes | Yes | No | No | Yes | No | No |
| Primer/Adapter removal | Yes | No3 | No | Yes | Yes | No | Yes4 | Yes |
| Homopolymer trimming (Roche 454 data) | Yes | No | No | No | No | No | No | Yes |
| Paired-end data integrity | Yes | No | No | No | No | No | No | No |
| QC of 454 paired-end reads | Yes | No | No | No | No | No | No | No |
| Sequence duplication filtering | No | No5 | Yes | No | Yes | No | No | Yes |
| Low complexity filtering | No | No | Yes | No | Yes | No | No | No |
| N/X content filtering | No | No6 | Yes | No | Yes | No | No | Yes |
| Compatibility witd compressed input data | Yes | Yes | No | No | No | No | No | No |
| GC content calculation | Yes | Yes | Yes | No | No | No | No | No |
| File format conversion | Yes | No | No | No | No | No | No | No |
| Export HQ and/or filtered reads | Yes | No | Yes | Yes | Yes | No | Yes | Yes |
| Graphical output of QC statistics | Yes | Yes | No7 | No | Yes | Yes | No7 | No |
| Dependencies | Perl modules: Parallel::ForkManager, String:Approx, GD::Graph (optional) | - | - | - | Perl module: GD::Graph | R, matrix2png | - | BLAST, NCBI nr database |
Best practices for analyzing and understanding RNA-seq data clearly depends on the ultimate goal of the experiment: data processing to identify alternatively spliced and/or novel isoforms is wildly different to a pipeline to perform differential gene expression calling. However, regardless of the eventual goal, all data analysis will begin with quality control and pre-processing. Any major biases present in the raw data produced by the sequencer can be identified using one of several QC-dedicated programs (Table 1) [87]. Fastqc [12], MultiQC [12], and similar tools use the raw sequences provided in fastq format (Table 2) and display basic statistics to allow a quick evaluation of whether sequences are as expected. Outputted parameters include number of reads and GC percentage, per base sequence quality score (a measure of confidence of correct base calling), per base sequence content (a representation of each nucleotide at each base position to visualize position/sequence bias), per base N content (a plot of uncalled nucleotides (N’s) at each base position), duplicate reads (typically a result of PCR over-amplification during library preparation) and overrepresented sequences and K-mers. It is important to evaluate the report in the context of the anticipated results, since QC programs assume sequencing of a random and diverse library, which may not be the case depending on experimental design and library preparation. As mentioned earlier, base calling error rate is highest during the final cycles of sequencing and it is not uncommon for per base quality score to be low (a quality score (in Phred units) of 20 equates to a 1% error rate).
| File type | Description | Source of file | Reference(s) |
|---|---|---|---|
| FASTQ | Contains nucleotide sequence and corresponding quality scores together with read identifier | Raw output from sequencer | [88], FASTQ |
| SAM/BAM | Tab-delimited text file containing read alignment data, flags to indicate number of matches, mismatches and presence of correct mate read (in the case of paired-end reads). Note: Bam is a binary (not directly human viewable) version of a Sam file. | Output from aligner (TopHat, STAR, etc) | [89] |
| GTF | A general purpose tab-delimited file containing information about a list of genes. One gene per line, with characteristics such as feature type (CDS, UTR, intron etc), start and end coordinates, strandedness and miscellaneous comments. | Depending on organism, downloadable from sources such as UCSC, Ensembl etc. | Ensembl, WUSTL GTF22 |
Pre-processing prepares sequences for read alignment. If libraries were barcoded, they should be demultiplexed using either internal barcode sequence or a separate index read sequence. Additionally, a trimming step to remove 3’ nucleotides with low quality should be performed. In addition to improving the quality of alignment, removing or trimming reads with low-quality base calls expedites mapping and reduces the computational resources consumed during later stages of analysis.
Following completion of any necessary trimming using Cutadapt [90], or Trim Galore [12], reads are ready to be aligned ab initio to a reference genome or de novo to a new transcriptome assembly. For most model organisms, aligning to the reference genome is sufficient and will allow quantification of known genes and transcripts. Advantages of alignment to a reference genome include more efficient computing and elimination of contaminating reads, for example from microbial genomes, since they are unlikely to align correctly [91]. However, alignment to a reference relies on a good quality genome build; any errors, such as genomic deletions or rearrangements are problematic.
Bowtie 2 [92] is the first step of the Tuxedo suite of RNA-seq software, and efficiently maps reads to a reference genome. For example, Chopra S et al aligned RNA-seq data from mouse bone marrow–derived dendritic cells against mm10 mouse genome with Bowtie 2 [23]. Although it allows for gapped alignment, Bowtie is best suited to aligning genomic DNA reads since it does not consider introns/splicing. A better choice is TopHat 2, which uses Bowtie but additionally analyzes mapping results to identify splice junctions [93], as for example, it was used for the RNA-seq analysis of T cells [94], and phagocytes [95]. An alternative is STAR, which is also splicing-aware but reportedly 50-times faster at aligning than TopHat 2 with better alignment precision and sensitivity [96]. For example, STAR v2.4.0 was used in single-cell RNA-seq analysis of mouse embryonic neurons [97], and for NASA twin astronaut blood samples [12], among others [18, 20]. Both aligners ultimately generate a BAM file as output which can be used in subsequent stages of analysis. An in-depth tutorial described the start-to-finish analysis of mapping and differential expression testing using the Tuxedo suite in depth [98] (Figure 8). More recently, De Cecco M et al used HiSat2 to align 70 million reads to the GrCh38 build of the human genome. So did Y Johmura et al [37].

Computational advances in de novo transcriptome assembly allow RNA-seq analysis of unsequenced genomes [61, 99, 100], although as early non-model organism transcriptome studies demonstrated, utilizing genomic resources from closely related species as a template can aid assembly [101, 102]. However, to obtain a reliable and useful assembly, a higher number of mappable reads are required [91]. For example, in their paper describing the Trinity de novo assembler, Grabherr et al used 52.6 million read pairs when reconstructing a mouse transcriptome [99]. The quality of the resulting transcriptome assembly can be evaluated in several ways. Assemblies can be directly viewed in the Integrated Genomics Viewer (IGV; [103] ), the number of potential full-length transcripts determined using the reference genome of a closely related organism, and the potential coding regions extracted and functionally annotated using TransDecoder and Trinotate, both part of the Trinity package [104]. Given the above advantages and disadvantages of reference-based and de novo-based alignment, some studies have used a combination of both: reads are first mapped to a reference and any reads that fail to align used for de novo assembly [91] correctly.
GSNAP [105] can also be used for the mapping [106].
One of the most frequent applications of RNA-seq, analogous to microarray experiments, is to identify differentially expressed genes between two or more groups. The number of reads mapping to each RNA species is linearly related to its abundance within the cell [1]. Therefore, the number of reads discretely mapping to each gene or isoform may be used to infer the level of expression. However, a normalization step must first be performed to account for differences between libraries. The main bias that normalization seeks to resolve is the total library size (i.e., the number of aligned reads/sequencing depth) since this will vary sample-to-sample. Additionally, as mentioned earlier, longer transcripts are more likely to be sequenced than a short transcript and read coverage is often not uniform. Several normalization procedures have been developed in recent years, although the relative advantages and disadvantages are still being assessed by the community and no first choice is obvious. However, a recent report from The French StatOmique Consortium that directly compared the most frequently used normalization techniques sheds some light on the issue [107]. The simplest normalization methods scale read counts that map to each locus by the total number of reads. These include total count, upper quartile and median normalization methods, where the number of gene reads is divided by the total number of mapped reads and multiplied by total, upper quartile or median number of reads from all sequenced libraries to be analyzed in the experiment, respectively. Two R/Bioconductor [108] packages, DE-Seq [109] and edgeR [110], implement similar normalization methods to calculate a gene-specific scaling factor based on the assumption that the majority of genes are not differentially expressed. The final normalization methods tested by Dillies et al was quantile normalization, which is typically used for normalization of microarray data, and FPKM normalization. Unfortunately, the most widely used FPKM-based normalization failed to sufficiently normalize variation between samples, had high false-positive rate and did not adequately reduce the coefficient of variance of a pool of 30 housekeeping genes [107]. In contrast, DE-Seq/edgeR normalization both resulted in the lowest coefficient of variance of all methods tested and low false-positive rate after testing of simulated and real data. However, whether the underlying assumption of DE-Seq/edgeR that the majority of genes are not differentially expressed holds true in all cases is not clear. Overexpressed and underexpressed genes may not balance out and recent observations of widespread transcriptional amplification in cells overexpressing c-Myc highlights the need for careful decision making when choosing a normalization method [111-113]. Alternative strategies might be to re-visit normalization after differential expression testing to remove differentially expressed genes prior to estimation of scaling factors [114] or to make use of synthetic RNA spike-in transcripts [113], for instance, ERCC spike-in (Thermo fisher 4456740) [12, 17].
Following library normalization, statistical testing for differential expression can be performed. Two widely used counts-based workflows make use of the R/Bioconductor statistical computing environment [108]. In addition to performing count normalization, EdgeR and DE-Seq both test for differential gene expression using a negative binomial distribution [109, 110]. First, a matrix containing a number of reads corresponding to each gene of interest for every sample is prepared using a Python script called HTSeq-count [115]. Next, edgeR or DE-Seq uses the counts table with biological replicates to calculate variation and test for statistically significant differential expression. Both tools can be operated at the command line or in the MultiExperiment Viewer (MeV) software, which has a convenient graphical user interface [116]. Importantly, both methods are able to make use of ANOVA-like generalized linear models (GLMs) to analyze complex experimental designs. This enables users to control for any known batch effects introduced during library preparation, as well as analyze time course experiments and experiments with greater than two groups. Additionally, both methods use the Benjamini-Hochberg procedure to control the false discovery rate (FDR) associated with multiple hypothesis testing. featureCounts is a popular choice for counting [20] and as is edgeR for mapping [117, 118].
On the other hand Cufflinks/Cuffdiff [119, 120], part of the Tuxedo suite, are FPKM-based. The Cufflinks component attempts to assemble aligned reads into transcripts, isoforms, and genes whilst simultaneously identifying transcriptional start sites (TSSs) whereas Cuffdiff tests for statistically significant differences in expression in the Cufflinks output. Although unable to apply GLMs, Cuffdiff has a number of advantages over DE-Seq/edgeR. In particular, for those uncomfortable using R/Bioconductor and the command line, Cufflinks/Cuffdiff, along with all of the other tools in the Tuxedo suite, are implemented in Galaxy. A major technical advantage of Cuffdiff is its ability to detect and test differential isoform expression but with the significant disadvantage that GLMs and complex multi-group comparisons are not supported. Quantification of isoforms is arguably one of the most challenging, but important, aspects of RNA-seq experiments, since quantifying expression at the gene level may mask alterations at the transcript level if two or more isoforms have opposite expression patterns.
During alignment reads frequently map to multiple regions which leads to ambiguity when deciding the true origin of the read. By default, Cufflinks will uniformly divide multi-mapped reads among all the positions that it maps to. Optionally, multi-read correction can be performed to assign reads probabilistically. However, ambiguity also exists when considering multiple isoforms transcribed from a single open reading frame (ORF). Consider the example of a full-length transcript and truncated transcript resulting from alternative polyadenylation (Figure 9). Although assignment of reads mapping to the 3’ exons of the full-length transcript is unambiguous, 5’ exon reads could originate from either the full-length or truncated transcript. Cuffdiff attempts to resolve this problem by probabilistic deconvolution to assign reads to the correct isoform. Cuffdiff may, therefore, be more appropriate than edgeR/DE-Seq when characterizing transcriptomes where alternative splicing is frequent since a constant number of reads per gene might mask differential expression of two or more isoforms. However, the landscape of tools available for isoform quantification is rapidly evolving, and the authors of DE-Seq have recently published a variation of their negative binomial method called DEXSeq [121]. Rather than testing for a significant difference in the number of reads per gene between samples, DEXSeq tests whether individual exons are differentially expressed. During testing against Cuffdiff (version 1.3), the DEXSeq authors observed a far higher number of false positives identified by Cuffdiff. However, shortly after publication, a new version of Cuffdiff (version 2.0) was published and released [119]. Unfortunately, to date, a comprehensive direct comparison of DEXSeq to Cuffdiff 2.0 has not been published.

After obtaining a list of differentially expressed genes and/or transcripts, visualization and higher level analysis can proceed analogously to microarray experiments with minor modifications. The newer versions of MeV [116], which was designed for analysis of microarrays, has several modules specifically designed for RNA-seq data. One such MeV module, which is based on the GOSeq R/Bioconductor package [10], tests for enrichment of Gene Ontology (GO) terms associated with a list of significantly over- or underexpressed genes. Unlike microarray GO analysis, lists of differentially expressed genes identified by RNA-seq are biased towards longer transcripts, since there is greater statistical power to call strongly expressed genes as differentially expressed. At the same time, Young et al observed that some GO categories are enriched for short or long transcripts [10]. The GOSeq method attempts to control for length bias and optionally selection bias. Since microarray analysis is not subject to the same length bias, samples analyzed by microarray were compared to RNA-seq gene lists with and without bias correction. The GOSeq bias correction method resulted in more GO categories consistent with the microarray interrogation [10]. The same GOSeq method is available as a stand-alone package in R/Bioconductor, along with numerous packages for hierarchical clustering, preparation of heatmaps, principal component analysis (PCA) and visualization. CummeRbund, the final component of the Tuxedo suite, is an R/Bioconductor package specifically designed to visualize the Cuffdiff output and offers many of the same functionality [98].
Much has been made of the fact that recent advances in NGS productivity violate Moore’s Law, the prediction originally applied to computing that states that the number of transistors per microprocessor will double every two years (Figure 10). Per base sequencing costs have decreased significantly concomitant with increased sequencing output. Output increases are largely due to the increased number of reads, and longer read length and this trend continues apace. However, some of the most exciting emerging technologies will potentially address the known biases and disadvantages of RNA-seq, such as eliminating fragmentation, reverse transcription and PCR amplification biases and reducing input requirements. Sample input requirements are currently at the stage where RNA of a single eukaryotic cell may be sequenced with existing technologies [46, 122-125]. However, these approaches have relied on various degrees of amplification by PCR or in vitro transcription. A sequencing method that does away with the need to amplify convert RNA to cDNA will allow an undistorted picture of the transcriptome. Direct RNA sequencing (DRS) from Helicos BioSciences has paved the way to achieving this feat by capturing polyadenylated RNAs on a flow cell followed by sequencing by synthesis using fluorescently labeled nucleotide analogs, akin to Illumina sequencing [126-128]. Ultimately, the DRS system has not proved to be commercially viable due to a combination of high error rate, a short read length and an inability to carry out paired-end sequencing. However, Helicos intellectual property rights have been licensed to Illumina and Life Technologies raising the exciting possibility of Illumina/Ion Torrent-like DRS in the near future.

The ability to sequence longer transcripts, and eventually full-length transcripts, removes the uncertainty when quantifying alternatively spliced genes [129]. In addition to allowing long sequencing reactions, nanopore sequencing also might also permit the sequencing of RNA without amplification [130]. NP Roach et al sequenced poly(A)-selectet transcripts from worms with Oxford Nanopore Technologies SQK-RNA001 kit and Oxford Nanopore Technologies GridION X5 and obtained average read lengths from 739 to 934 [129]. In nanopore sequencing either biological (e.g., α-hemolysin [131] ) or synthetic (e.g., graphene [132] ) nanopores are embedded in a synthetic polymer membrane. An electric current is applied across the nanopore; as each nucleotide passes through the nanopore, a nucleotide-specific disruption in charge is detected. Elimination of the requirement to use fluorescence allows a far higher density of nanopores, faster sequencing, and hence greater sequence output. Oxford Nanopore Technologies is developing an α-hemolysin nanopore-based sequencer that has already been demonstrated to determine sequence identity of single-stranded DNA [131]. Although sequencing of only up to 85-mer DNA oligos was reported in their paper, in a 2012 press release sequencing of the entire 48 kb lambda genome as a single, complete fragment was disclosed [133]. Whether sequencing of full-length RNA or cDNA fragments can be similarly achieved remains to be determined. In the meantime, long reads can be obtained by 454 and Pacific Biosciences sequencing platforms (1 kb and > 10 kb, respectively), although relatively few reads are generated and are therefore better suited to genome sequencing.
As described above, RNA-seq data analysis is performed in a number of consecutive steps for which numerous tools, computational and statistical approaches have been developed, and become available continuously. Trimmomatic [134] for read trimming and adapter removal; FastQC for datasets quality control; Bowtie [58] and TopHat/TopHat 2 [135] to align reads to a reference genome, for example in [37, 136] ; SAMtools [118, 136] to sort the BAM files, HTSeq [137] or RSEM [23] to count transcript abundance; and Kallisto [17, 138], DEseq2 [18, 20], Cufflinks [37, 139] and edgeR [18] to identify and quantitate expressed genes and transcripts, QIAGEN’s Ingenuity® Pathway Analysis software [23], Sleuth [17, 138], Quantitative Set Analysis for Gene Expression (QuSAGE) [137, 140], Cuffdiff [94, 139] to calculate gene set enrichment, are only a few examples, some of which were described in detail above. A more comprehensive list, continuously updated can be found here (https://en.wikipedia.org/wiki/List_of_RNA-Seq_bioinformatics_tools) for reference.

However, the problem of choosing the right combination of tools for each particular experimental goal remains. As of 2015, developing user-friendly analysis pipelines became the focus of more and more research groups. Efforts were even directed to creating toolboxes for building such automatic analysis paths (ViennaNGS [141], NEAT [142] ), and guides for creating and using computing workflows [143], [144] and RNASeqGUI [145], or explicit demonstrations of data analysis [146]. However, many of these instruments still require validation on real data sets and confirmation with experimental biological results.
Below, we describe applications for which tools have been developed or improved recently. We do not attempt to create an exhaustive list, as the field is rapidly expanding and more and more examples become available every day. Quantification of gene expression under different experimental conditions, identification of novel transcripts, alternatively spliced sites or editing events, and the detection of RNA-fusion transcripts are major applications of RNA-Seq. To these, one can add the detection of non-coding and small RNAs, single-cell RNA-seq and various others.
Most of the current analysis workflows have been developed for the study of eukaryotic RNA, but also several analysis packages were created for bacterial RNA analysis. Table 2 includes brief descriptions of automated analysis pipelines designed to perform whole transcriptome analysis with an emphasis on gene identification and differential gene expression patterns.
| Tool | Year | URL | Features |
|---|---|---|---|
| BrowserGenome [147] | 2015 | http://www.browsergenome.org/ | Web-based RNA-seq data analysis and visualization. |
| Catnap [148] | 2016 | http://psychiatry.med.miami.edu/research/laboratory-of-translational-rna-genomics/CANE-app | User-friendly; automated differential gene-expression analysis; novel noncoding RNA discovery through alternative workflows (Cuffdiff and R packages edgeR and DESeq2); validated experimentally; handles large amounts of data efficiently. |
| expVIP [149] | 2016 | www.wheat-expression.com | Web based analysis of public and user-specified datasets; allows user to visualize sort and filter the RNA-seq data; permits comparison of RNA-seq data across experiments; performs differential gene expression analysis. |
| GeneGazer [150] | 2016 | NA (The source codes for GeneGazer are available on request.) | Toolkit comprising of two parts: Gaze_Profiler – identifies somatic gene alterations from paired samples; Gaze_BioSigner – used for the discovery of disease-associated biomarkers from expressional and mutational profiles. |
| NGS-Trex [151, 152] | 2013 2015 | http://www.ngs-trex.org | Fully automatic analysis workflow; web interface; data analysis from raw sequences; identifies expressed genes, transcripts, and new and known splice variants; detects differentially expressed genes and transcripts across different experiments. |
| RAP [153] | 2015 | http://bioinformatics.cineca.it/rap/ | User friendly web interface; automatically executes data quality checks (adopting FastQC and NGS QC Toolkit); identification and quantitation of expressed genes and transcripts (with TopHat, Cufflinks and HTSeq); detection of alternative splicing events (using SpliceTrap) and chimeric transcripts (with ChimeraScan); identifies splicing junctions and constitutive or alternative polyadenylation sites (custom analysis modules); indicates statistically significant differences in genes and transcripts expression, splicing patterns and polyadenylation site usage (using Cuffdiff2 and DESeq); tabular and graphical results easy to browse, filter and export. |
| SPARTA [154] | 2016 | http://sparta.readthedocs.org/en/latest/ | Easy-to-install; complete automatic workflow for processing of whole transcriptome sequencing data; provides analysis reports, gene feature counts and differential gene expression tables and scatterplots. |
| T-Rex [155] | 2015 | http://genome2d.molgenrug.nl | User-friendly webserver; statistical analysis of gene expression; |
Many of the RNA-seq data analysis packages include tools for the identification of alternate splice or RNA editing sites. Several specialized software suites were improved or designed recently. Among the applications developed for the identification of alternative splicing events are: SplicingViewer [156] (http://bioinformatics.zj.cn/splicingviewer) and JETTA [157] (http://igenomed.stanford.edu/~junhee/JETTA/index.html) available since 2012; SplicingTypesAnno [158] (http://genome.sdau.edu.cn/research/software/SplicingTypesAnno.html); SplicingExpress [159] (http://www.bioinformatics-brazil.org/splicingexpress); and SpliceJumper [160] (https://github.com/Reedwarbler/SpliceJumper) since 2015; and CLASS2 [161] (http://sourceforge.net/projects/Splicebox) since 2016. For the identification of editing sites we can mention two recently published methods - ICE-seq [162] and the genome sequence-independent method of Zhang and Xiao [163] that stand out among other several new tools - REDItools [164], RCARE [165], RASER [166], RDDpres [167], and RED [168].
Computational schemes for detection of chimeric RNAs have also been developed during the last few years. The fusion transcripts contain exons from different genes that have the potential of encoding for new proteins with new functions that may lead to abnormal cell proliferation and cancer. Table ...contains some of the most used fusion gene detection software that were also recently tested in comparative studies. According to Kumar et al [169] EricScript is the most efficient tool, out of 12 tested, in terms of computational memory and time consumption, high sensitivity (78%) and positive predictive value (100%). However, the performances of the tools depend on the properties of the RNA-Seq datasets (read length, read number, and the quality of the reads), and as a consequence users should choose the analysis tool that bests fits their datasets. Similarly, Liu et al [170] performed a comparative analysis of 15 tools, and concluded that no single method performed best, even though SOAPfuse, FusionCatcher and JAFFA generally performed well. Multiple tools might be used for one project. For example, Wang et al, [171] used four different tools (Tophat2, FusionMap, SOAPfuse, and Chimerascan) to detect gene fusion events in human cancers from a compilation of a large number of RNA-seq data sets. They generated a comprehensive fusion-gene database: FusionCancer, available at http://donglab.ecnu.edu.cn/databases/FusionCancer/, which most likely facilitates the cancer gene fusion research.
| Tool | Year | URL | Description |
|---|---|---|---|
| EricScript [172] | 2012 | http://sourceforge.net/projects/ericscript/ | Perl based tool, using R, ada, BWA, SAMtools, Bedtools, seqtk, and BLAT for the identification of chimeric transcripts. |
| FusionCatcher [173] | 2014 | http://code.google.com/p/fusioncatcher/ | Uses Bowtie, Bowtie2, BWA, BLAT, Liftover, STAR, Velvet, Fatotwobit, SAMtools, Seqtk, Numpy, Biopython, Picard, and Parallel for fusion identification. |
| FusionQ [174] | 2013 | http://www.wakehealth.edu/CTSB/Software/Software.htm | Uses paired-end RNA-Seq data to detect gene fusions, construct the structures of chimerical transcripts, and estimate their abundances. |
| JAFFA [175] | 2015 | https://github.com/Oshlack/JAFFA/wiki | Uses Bpipe, Velvet, Oases, SAMtools, Bowtie2, BLAT, Dedupe, Reformat, and R packages, for the detection of fusions. |
| nFuse [176] | 2012 | https://code.google.com/p/nfuse/ | Advanced version of deFuse. Uses Python and R scripts, and external software like BLAT, Bowtie, Bowtie2 and Gmap. |
| PRADA [177] | 2014 | http://sourceforge.net/projects/prada/ | Starting from raw paired-end RNA-seq data analysis gene expression levels, quality metrics, detects fusion transcripts, and intragenic fusion variants. |
| SOAPfuse [178] | 2013 | http://soap.genomics.org.cn/soapfuse.html | Developed in Perl, aligns RNA-Seq paired-end reads to annotated genes and a human genome reference. |
| TopHat-Fusion [93] | 2013 | http://tophat.cbcb.umd.edu/fusion_index.html | Uses two scripts “Tophat” and “Tophat-fusion-post” for gene fusion analysis. |
During the last several years a wide range of micro-RNAs and small non-coding RNAs have been found to play vital roles. Thus, the interest in discovering new molecules and in understanding their functions increased together with the need for bioinformatics tool specific for their analysis. Analysis pipelines, as well as toolkits like the UEA sRNA workbench [179] or the sRNAtoolbox [180] facilitate analysis of expression profiling, differential expression, target gene prediction, identification of novel functional RNA and more. Many, of which we included a selection in Table 4 have been developed and are freely available.
| Tool | Year | URL | Features |
|---|---|---|---|
| CAP-miRSeq [181] | 2014 | http://bioinformaticstools.mayo.edu/research/cap-mirseq/ | Read pre-processing, alignment, miRNA detection and quantification, data visualization, variant detection in miRNA coding region, and differential expression analysis between experimental conditions. |
| Chimira [182] | 2015 | http://www.ebi.ac.uk/research/enright/software/chimira. | Web-based system for microRNA (miRNA) analysis from small RNA-Seq data. Automatic sequences cleaning, trimming, size selection and mapping directly to miRNA hairpins; identifies epi-transcriptomic modifications (chemical, editing, single nucleotide polymorphisms); visual study of differential expression between two specific samples or sets of samples; the identification of the most highly expressed miRNAs within sample pairs (or sets of samples) and also the projection of the modification profile for specific miRNAs across all samples. |
| FlaiMapper [183] | 2015 | https://github.com/yhoogstrate/flaimapper | Extracts and annotates the locations of sncRNA-derived RNAs (sncdRNAs). |
| ISRNA [184] | 2014 | http://omicslab.genetics.ac.cn/ISRNA/ | Genome mapping function, statistics for genomic location, length distribution and nucleotide composition; number of reads for known microRNAs and short non-coding RNAs, coverage of short reads on genes, expression abundance; management and comparison among multiple datasets. |
| MAGI [185] | 2014 | http://magi.ucsd.edu | Prediction of microRNA target genes, statistics for differential expression; diagnostic plot generation for quality control; interactive visualization and exploration of results. |
| miRseqViewer [186] | 2015 | https://github.com/insoo078/mirseqviewer or at http://msv.kobic.re.kr | Interactive; visualizes the sequence alignment, secondary structure and normalized read counts in multipanel windows; handles multiple samples of multiple groups; allows the sorting, zooming, highlighting, editing, filtering, saving, and exporting of data. |
| OASIS [187] | 2015 | http://oasis.dzne.de | Web-based; differential gene expression; biomarker detection; batch submission of jobs; analysis of novel miRNAs, miRNA targets and functional analyses including Gene Ontology and pathway enrichment; downloadable interactive web reports; easy visualization, exploration and analysis of data . |
| piPipes [188] | 2015 | http://bowhan.github.io/piPipes/ | Analyzes piRNA and transposon-derived RNAs from high-throughput sequencing libraries; produce figures and tables suitable for publication. |
| Transcriptator [189] | 2015 | http://www-labgtp.na.icar.cnr.it/Transcriptator | Web application; helps the users to characterize the de-novo assembled reads, for non-referenced organisms, performs the functional enrichment analysis of differentially expressed transcripts/genes for both RNA-seq and micro-array experiments; easy to read tables and interactive charts; modular pipeline allows additions of new plugins in the future. |
Single-cell RNA profiling (scRNA-seq) experiments became more visible during the last few years, and a comprehensive review of the specific design and computational analysis methods has recently been published [190]. The smartseq2 protocol has been commonly used for full-length coverage of polyadenylated RNAs [191, 192]. Most available tools allow the detection of major cell types and states, through the identification and quantitation of cell-type specific transcripts. For example, Bai L et al identified 12 sets of subdiaphragmatic vagal sensory neurons based on RNA-seq of individual cells retrogradely labeled from different peripheral innervation targets (target-scSeq) [193]. Aztekin C et al identified a novel cell type responsible for regeneration in the Xenopus tail through scRNA-seq [194]. SINCERA [195], a new analytic pipeline for processing single-cell RNA-seq data from organs or sorted cells, allowed Guo et al to distinguish the major cell types (epithelial, endothelial, smooth muscle, and fibroblast-like cells), and to identify cell type-specific gene activities [195] by performing RNA-seq analysis of single cells isolated from embryonic mouse lung at E16.5. A scRNA-seq survey of 53,193 epithelial cells of the mouse small intestine in homeostasis and during infection identified markers all small intestinal differentiated cell types and major subtypes [196].
Most recently Ntranos et al [197] suggest a new approach for scRNA-seq analysis, in which single-cells are not clustered based on transcript read counts, but based on transcript-compatibility counts that act as “distinctive signatures for each cell’s gene expression”. The method shows higher speed and similar results with more “conventional” approaches. NICHE-seq, combining photoactivatable fluorescent markers, two-photon laser scanning microscopy, and flow cytometry-based fluorescence-activated cell sorting coupled to massively parallel scRNA-seq, enables spatially defined RNA-seq analysis [198]. Another approach is useing array-based barcoded solid-phase RNA capture for spatial transcriptomics profiling [199-201], although this is not at the single-cell level. GS Gulati et al observed that the number of genes expressed in a cell decreases during differentiation and developed a computational framework - CytoTRACE - to dissect cellular hierarchies [202].
Below are reported the main techniques that allow the preparation of a scRNA-seq library, focussing mainly on single cell isolation methods and library preparation.
The transcriptomic analysis is a potent tool for potentially mapping genotypes to phenotypes, and single-cell RNA sequencing (scRNA-seq) has been shown to be a powerful technique for tackling this type of analysis. Eberwine et al [203] pioneered the single cell transcriptome sequencing, and Iscove et al [204] were the first to amplify the cDNA of a single cell by PCR. These techniques paved the way for scRNA-seq. However, only in 2009, the first next-generation sequencing platform for scRNA-seq was introduced [205]. Many methods have been introduced to perform single-cell transcriptomic analysis, but for all of the experimental design (i.e., which scientific question to address), sample preparation (i.e., processing the sample) and downstream data analysis (i.e., which computational tool) are of fundamental importance. Sometimes, Nuclei are sometimes isolated in stead of cells and subjected to further analyses, such as single-nucleus RNA-seq [206], to minimize any contamination from other cells or degradation encountered with whole-neuron dissociation or laser caption micro-dissection [206, 207].
- Limiting dilution. Cells are isolated individually using a pipette by serial dilution. Easy and fast method but not very efficient because the probability to have only one cell in an aliquot follows a statistical distribution (Poisson’s distribution) [208, 209].
- Micromanipulation or manual cell picking. Cells are isolated individually using an inverted microscope which has a movable stage with micro-pipettes. The separation is performed via microscope observation to pick a specific cell [208]. However, this method is time-consuming, and it allows to isolate not many single cells [209].
- Fluorescence-activated cell sorting or FACS. It is one of the most common methods to isolate highly pure single cells. Cells can be sorted individually directly into tubes or 96/384-well plates. FACS sorting is based on the specific light scattering and fluorescent characteristics of each cell. Briefly, during the sorting, the stream of cells is broken into individual droplets. When a particle is recognized based on predefined sorting criteria, an electrical charge is placed to the stream just as the droplet containing that particle break off the stream. The charged droplets then fall through two charged plates that divert droplets into containers depending on the droplet charge. The limit of this method is the large starting materials required to perform the sorting.
- Laser-assisted tissue microdissection. The basic principle of laser-assisted tissue microdissection system is the capture of single cells or groups of cells onto a thermoplastic membrane from stained tissue histological sections (frozen sections or fixed wax-embedded sections) or cytological preparations. There are two major systems that have been developed for performing laser-assisted tissue microdissection namely laser capture microdissection and laser beam microdissection [210]. In the laser capture microdissection, the plastic membrane that overlies the tissue section is attached to a specially designed “cap” and ensures that the plastic membrane is held in direct contact with the tissue section. The plastic is transiently melted by a low-power narrow-beam infrared laser directed at the cells of interest under microscope control. As the plastic cools and solidifies again, the cells are embedded into the plastic membrane and are removed from the tissue section by lifting the cap along with the plastic membrane off the tissue sections. In the laser beam microdissection, a pulsed very narrow-beam ultraviolet light laser is used to “draw” around the cell of interest and unwanted tissue is photoablated. In some systems, the laser can be used to “catapult” the microdissected cell fall into the collecting tube, whereas in some other system the section is inverted so that after microdissection the microdissected cell falls into the collecting tube under the influence of gravity. The major limitation of laser-assisted tissue microdissection is the need to identify the cells of interest based on morphological characteristics.
- Microfluidics. In the last few years, the microfluidic technology has become very popular since it requires a little amount of sample and it is cost-effective. This method is based on different principles. The most popular are the hydrodynamic cell traps (Fig. 5a) and the microdroplet-in-oil based isolation. The hydrodynamic cell trap is characterised by passive elements that fit only one cell in the trap. The microdroplet-in-oil based isolation uses channel filled with oil to grip aqueous droplets where single cells can be confined and thus be isolated as a single cell. The advantage of this system is that it requires a low volume and allows the screening of up to thousands of single cells per second. Broadly used commercial platforms that take advantage of the microfluidic technologies are the Fluidigm C1 platform (hydrodynamic cell traps) and the Chromium system from 10x Genomics (microdroplet-in-oil based) which are now widely used for scRNA-seq [136, 211]. For example, Packer JS et al captured C. elegans single cells and prepared sequencing libraries with a 10X Genomics system to identify 502 terminal and pre-terminal cell types and resolve the lineage of individual cells during embryogenesis [212]. He M et al processed epidermal cells with 10x Genomics Chromium Single Cell 3’ Library and Gel bead kit v2 and quantified the scRNA library with Kapa Library Quantification Kit (Kapa Biosystems) [22].
After the isolation of single cells, the steps required for the preparation of a scRNA-seq library are i) lysis of the cells, ii) reverse transcription into complementary (c)DNA, iii) second-strand cDNA synthesis, and iv) amplification of the cDNA. Normally, the lysis buffer is a hypotonic solution containing RNase inhibitors. The first strand of cDNA is then generated using poly(dT) primers that bind the mRNA. The transcriptase used at this stage is characterised normally by a low RNase H activity and enhanced thermostability. The reverse transcription primers can have extra nucleotides attached to one end such as adaptor sequences or unique molecular identifiers (UMIs) which are random n-mer oligonucleotides. This system allows the assignment of each read to its original cells. Next, the second strand of cDNA is generated and the cDNA amplified by conventional PCR or in vitro transcription. The second method requires an additional reverse transcription step, thus is more time-consuming. The amplified and tagged cDNA from different cell types is then pooled and sequenced by next-generation sequencing (NGS).
Nowadays, experimental methods for scRNA-seq are more accessible due to the presence of platforms that provide all the reagents (e.g., Fluidigm and 10x Genomics). The analysis of the raw data generated is still the more difficult part, and it requires bioinformatic support. Though companies, such as Fluidigm and 10x Genomics, offer free software, for example, 10x Genomics Genomics CellRanger [212], in order to perform steps like quality control, analysis, and interpretation of scRNA-seq data. However, the limit of this software is that the algorithmic and parameters used are non-totally transparent.
Analysis workflows have also started to be developed for a diverse array of less common, but also important research topics. To give just a few examples, VIP [213] was developed for the identification and discovery of viruses, and it is available at https://github.com/keylabivdc/VIP. Also, fully automated pipelines were developed for the identification of sex chromosome-linked genes in species without an existing reference genome [214] or to determine the expression levels of SINE retrotransposons [215], and Allelome.Pro [216] was developed for identification of allele-specific genomic features.
Poly(A) selection is the most routinely used strategy for rRNA depletion in high throughput RNA seq studies. A key disadvantage of this method is the inability to capture functional non-poly(A) small RNAs. Poly(A) transcripts represent a small proportion of total RNA. Current literature suggests an overwhelming presence of biologically functional non-coding RNAs and protein-coding transcripts without poly(A) tails. Therefore, using the right method to reduce the representation of abundant rRNAs from the sample is significant, considering the efficacy of rRNA depletion methodologies varies depending on the sample type and study objective. Comparative analyses between these two methods in different sample types suggest each of them offers distinct advantages over the other [35, 217-219].
Isolation of intact RNA from tissues with high protein and lipid content, such as mouse brain, present distinct challenges. The RNA can have significant effects on downstream gene expression techniques like RNA-seq. Cui et al compared the efficacy of poly(A) capture and Ribo-minus on transcriptomic efficiency using mouse cerebrum tissues [35]. As expected, a significantly higher number of high-quality reads were obtained with poly(A) capture, of which ~60% were mapped to exon-exon junctions. In contrast, only 30% reads mapped to exons, and ~44.15% were within the intergenic regions with Ribo-minus depletion. While reads mapped to exons correlated significantly between the two methods, Ribo-minus seq data identified uniquely annotated transcripts with a broad representation of long non-coding RNAs and a small number of protein-coding transcripts.
In contrast, both these methods identified an equivalent number of active gene transcripts, of which ~96% were shared between the two. Differentially expressed genes from both the methods demonstrated significant correlation, thus unequivocally showing their applicability in problematic tissue types. Further, this study verified a unique advantage of Ribo-minus rRNA in simultaneous identification of novel non-coding RNAs along with coding RNAs.
Isolation of high-quality RNA from pathological tissues is a challenge. Also, it is not possible to obtain high amounts of RNA if the quantity of available tissue is limited. Analysis of RNA seq reads from low-quality/low-quantity RNA is often biased owing to high representation of certain RNA populations. The effect is perpetuated with the use of poly(A) enrichment. Schuierer et al used intact and poor-quality human reference RNA samples (universal and brain) to evaluate the performance between transcriptomics sequenced after Tru-Seq (mRNA capture by poly(A)), Ribo-zero (ribosome depletion) and Ribo-Access (exome capture) methods [220]. Overall, study findings suggest the performance of Ribo-zero was significantly better and consistent amongst the three methods. Quality and alignment of reads from Ribo-zero and Ribo-Access were highly consistent between high- and low-quality RNA even at low amounts of starting material. Aligned reads from Ribo-zero mapped to a significantly high number of coding and non-coding transcripts, with an equivalent % distribution within exonic and intronic regions. Taken together, this study clearly defines the limitations of poly(A) enrichment as a method of choice for reducing rRNA content when the sample quality is compromised. Ribo-zero and Ribo-Access offer an attractive alternative due to their broad applicability irrespective of RNA quality or quantity.
A key obstacle in conducting genomic studies on clinical samples is to obtain freshly frozen (FF) tissues. In such a scenario, tissue banks comprised of either cryopreserved or formalin-fixed paraffin-embedded (FFPE) tissues offer an ideal alternative. However, obtaining reproducible RNA-seq data from such a tissue type is difficult owing to high amounts of partially degraded RNA accumulated over time due to storage. To determine reliable alternatives, Zhao et al performed a comparative assessment between polyA+ capture, Ribo-Zero and duplex-specific nuclease (DSN) degradation in fresh frozen tissues and evaluated gene expression by RNA sequencing [218]. However, only Ribo-Zero and duplex-specific nuclease (DSN) degradation were used in FFPE tissue considering the disadvantages associated with polyA+ capture. Compared to the polyA+ method, Ribo-zero method demonstrated a similar magnitude of rRNA depletion efficiency, both in fresh frozen (FF) and FFPE tissues.
Similarly, both methods had an identical gene alignment profile in terms of %aligned bases to the reference genome. In contrast, DSN-seq method had a significantly higher rRNA depletion rate but demonstrated lower %gene alignment. Also, the relative coverage of exons was considerably higher (~62.5%) compared to Ribo-zero and DSN-seq (31.5% and 22.7% respectively). Further analysis of the reads and coverage revealed a high degree of concordance in gene quantification between the methods in both the tissue types, while higher sensitivity was observed in Ribo-zero and DSN-seq in frozen tissues. Biologically, all the three methods consistently identified ~350 differentially expressed genes and demonstrated correlation with microarray data, despite polyA+ capture showing higher sensitivity. In contrast, Ribo-Zero seq identified a high number of reads in the intronic and intergenic regions, apart from identifying pre-mature mRNAs. In conclusion, this study showed the usability and distinct advantages of these two methodologies in gene quantification by RNA seq even from tissues as hard as frozen and FFPE sections.
In a related study, matched breast tumor tissues (FF and FFPE) were used to evaluate the difference between polyA+ capture and Ribo-Zero rRNA depletion methods. Study findings suggest capturing transcripts using poly(A) tail can be a very effective alternative for rRNA depletion in FFPE tissues even at low amounts of RNA. Both these methods demonstrated variable rRNA removal efficiency based on the tissue. While polyA+ selection had superior efficacy on FF tissues, Ribo-Zero performed better on FFPE samples. At the same time, a higher fraction of exonic regions was mapped through polyA+ selection in both sample types, albeit, a lower percentage of reads was seen in FFPE compared to FF tissues. Interestingly, differential gene expression correlated significantly matched tissue pairs with use of poly(A) capture in FFPE tissues, despite the presence of 3’-end bias [221].
Zhao et al used human blood and colon tissue samples to evaluate the performance of positive (poly A+ capture) and negative methods (Ribo-zero Gold) for rRNA removal before RNA sequencing and demonstrate their usability in clinical studies [217]. While the study findings were mostly similar to published literature, this study showed that the performance of poly (A) is significantly better than Ribo-zero with respect to coverage of exonic regions and quantification of protein-coding genes. Out of 50 million reads randomly selected following RNA seq, the number of mapped reads was identical between blood and colon tissues with poly (A). A significantly smaller number of reads were uniquely mapped to the reference genome with Ribo-zero and demonstrated a high degree of variability between blood and colon. Most importantly, the fraction of usable reads for gene quantification after normalization (with the total number of reads) was significantly higher in poly (A) method than Ribo-zero, both in the blood (71% vs. 22%) and colon (70% vs. 46%). Differential expression gene analysis further confirmed the utility of poly(A)-seq as the fraction (% fold change) of identified genes (both up and downregulated) was significantly higher in the colon and blood. Even though a high degree of concordance was observed between both methods in colon tissue for protein-coding genes, evaluation of intron rates and gene quantification analysis of randomly selected genes validated. In contrast, Ribo-zero was useful in identifying a large proportion of RNAs in non-exonic zones (~50% of mapped reads were located in introns) and small RNAs with a length shorter than 75bp, including microRNAs and small nucleolar RNAs (snoRNA).
It is well-known that poly (A) capture and rRNA depletion are selective in terms of their ability to exclude specific classes of RNA. Also, studies consistently showed overwhelming discrepancies in gene expression between these methods. In this regard, it is essential to select and use the right rRNA exclusion strategy based on the study objectives to achieve optimal RNA-seq data outcomes.
Transcriptional profiling using NGS platforms have given researchers a new window of the inner workings of the cell in development and disease. The field is progressing rapidly, with each new generation of sequencer offering reduced input requirements, simplified library preparation protocols and more reads of a longer length. This trend continues apace, and the next generation of sequencing strategies will address the disadvantages discussed in this review and finally allow an unbiased view of the transcriptome. Along with improvements at the level of each step required for the generation and analysis of RNA-seq data, new and improved automatic and user-friendlier workflows are expected to become available. Finally, the latest introduction of RNA-seq at single cell level will open new frontiers of research that will allow a better analysis of complex biological systems.
- Seqanswers, an active forum for all aspects of NGS
- Mailing list for announcements and general discussion regarding use of Bioconductor
- Mailing list for announcements and general discussion regarding use of Galaxy
- Independent sequencing guide with information about current and emerging NGS platforms
- NGS WikiBook
- Nature Reviews Genetics series on NGS
- RNA-seq blog: Transcriptome Research and Industry News
Dr. David C Corney wrote the original version of this article on August 27, 2013. Dr. Georgeta N. Basturea added the chapter "Automatic data analysis workflows" (and its associated figure and tables) on April 14, 2016. Dr. Elisa Corsiera contributed to the section about single-cell RNA-seq in Oct 2018 and single cell RNA-seq indexing / barcoding in Dec 2018. Dr. Vidyanand Anaparti contributed the section "Comparison between PolyA+ Selection and rRNA Depletion Methods" in Jan 2019.
- Ramsköld D, Luo S, Wang Y, Li R, Deng Q, Faridani O, et al. Full-length mRNA-Seq from single-cell levels of RNA and individual circulating tumor cells. Nat Biotechnol. 2012;30:777-82 pubmed
- Bartel D. MicroRNAs: genomics, biogenesis, mechanism, and function. Cell. 2004;116:281-97 pubmed
- Lau N, Seto A, Kim J, Kuramochi Miyagawa S, Nakano T, Bartel D, et al. Characterization of the piRNA complex from rat testes. Science. 2006;313:363-7 pubmed
- Giardine B, Riemer C, Hardison R, Burhans R, Elnitski L, Shah P, et al. Galaxy: a platform for interactive large-scale genome analysis. Genome Res. 2005;15:1451-5 pubmed
- Cutadapt removes adapter sequences from high-throughput sequencing reads. Available from: journal.embnet.org/index.php/embnetjournal/article/view/200
- Toth A, Varala K, Newman T, Miguez F, Hutchison S, Willoughby D, et al. Wasp gene expression supports an evolutionary link between maternal behavior and eusociality. Science. 2007;318:441-4 pubmed
- Collins L, Biggs P, Voelckel C, Joly S. An approach to transcriptome analysis of non-model organisms using short-read sequences. Genome Inform. 2008;21:3-14 pubmed
- Gentleman R, Carey V, Bates D, Bolstad B, Dettling M, Dudoit S, et al. Bioconductor: open software development for computational biology and bioinformatics. Genome Biol. 2004;5:R80 pubmed
- HTSeq: Analysing high-throughput sequencing data with Python. Available from: htseq.readthedocs.io/
- Luo J, Chang Y, Chang C, You J, Wei P, Chiou C. GeneGazer: A Toolkit Integrating Two Pipelines for Personalized Profiling and Biosignature Identification. Cancer Genomics Proteomics. 2016;13:141-50 pubmed
- FusionCatcher - a tool for finding somatic fusion genes in paired-end RNA-sequencing data. Available from: dx.doi.org/10.1101/011650
- Boisvert M. About an "unconfirmed" stand. J Palliat Care. 1990;6:6-7 pubmed
- Eberwine J, Yeh H, Miyashiro K, Cao Y, Nair S, Finnell R, et al. Analysis of gene expression in single live neurons. Proc Natl Acad Sci U S A. 1992;89:3010-4 pubmed
- Cano Gauci D, Lualdi J, Ouellette A, Brady G, Iscove N, Buick R. In vitro cDNA amplification from individual intestinal crypts: a novel approach to the study of differential gene expression along the crypt-villus axis. Exp Cell Res. 1993;208:344-9 pubmed
- Curran S, Murray G. An introduction to laser-based tissue microdissection techniques. Methods Mol Biol. 2005;293:3-8 pubmed
- Materials and Methods [ISSN : 2329-5139] is a unique online journal with regularly updated review articles on laboratory materials and methods. If you are interested in contributing a manuscript or suggesting a topic, please leave us feedback.
- method
- Cloning and Expression Vectors, and cDNA and microRNA Clones Companies
- LncRNA Research Resources
- MicroRNA Experimental Protocols
- MicroRNA Research Reagents
- MicroRNA Research Web Resources
- RNA Extraction
- RNA Imaging
- RNA Modifications
- Single Cell Technologies
- siRNAs and shRNAs: Tools for Protein Knockdown by Gene Silencing