An overview of live cell imaging methods.
Live cell imaging has revolutionized how biologists study cells, proteins and a multitude of processes and molecular interactions. Live cell imaging techniques allow scientists to observe cell structures and processes in real time, and over time. The observation of dynamic changes provides more insight into the operations of a cell than a snapshot provided by imaging fixed cells. Moreover, the spatial resolution of light microscopy allows observing subcellular structures, by using a range of fluorescent probes. Besides, since live cell imaging is less prone to experimental artifacts, it usually provides more reliable and relevant information than fixed cell microscopy. This review examines live cell imaging systems, fluorescent probes, methodologies, and applications. Jost AP and Waters JC published an excellent article about how to prevent errors in using microscopes, especially when quantitative experiments are performed [6].
Intravital microscopy observes physiological and cellular processes in live animals (for example, observing macrophages and endosomes inside mouse peritoneal serosa [7] ) and is not discussed here.
A wide array of biological questions exist that can be answered with live cell imaging. A few of the most popular applications include the examination of structural components of a cell, the study of dynamic processes, for example, chromatin looping [8], and the localization of molecules. Cellular integrity, endocytosis, exocytosis, protein trafficking, signal transduction, and enzyme activity can all be monitored. It is possible to study how molecules translocate, interact and respond to environmental cues. Furthermore, some imaging systems are capable of monitoring molecules within live animals. A recent example is the tracing of neural stem and progenitor cells in adult mouse brains for up to 2 months [9]. Table 1 shows the most common live-cell microscopy approaches and their current biological applications.
| Biological application | Microscopy Approach | Abbreviation |
|---|---|---|
| Cell shape – cell migration – organelle kinetics | Transmission Microscopy : Bright Field, Dark Field, Phase Contrast, Differential Interference Contrast | BF / PH / DIC |
| Protein colocalization - dynamics, organisation and structure of cells , organelles, proteins | Epifluorescence / Confocal / Spinning disk | |
| 3D imaging of live cells | Confocal / Spinning disk | |
| 3D imaging of tissues, model organisms, small animals – study structure and development | Multiphoton microscopy / light sheet microscopy | |
| Quantification of ion concentrations (calcium, magnesium) | ion imaging | |
| Biosensing and protein-protein interactions | Forster resonance energy transfer | FRET |
| Biosensing and protein-protein interactions without light excitation | Bioluminescence resonance energy transfer | BRET |
| Protein diffusion and kinetics | Fluorescence recovery after photo-bleaching | FRAP |
| Protein diffusion with high spatio-temporal accuracy (μs-s and 300-400nm) | Fluorescence correlation spectroscopy | FCS |
| Protein diffusion with single molecule mapping and high spatio-temporal resolution | Single particle tracking | SPT |
| Protein diffusion with single molecule mapping and high spatio-temporal resolution in dense samples | SPT photoactivated localisation microscopy | sptPALM |
The first concern for live cell imaging is to provide to cells an optimal physiological environment. In doing so, the scientist ensures that the cells not only stay alive but remain in a metabolic state with no nonspecific changes that could alter the process being observed. For short term imaging needs, cell health is less critical, but when imaging over hours or days, it is imperative to address the causes of altered metabolic function. The approaches include controlling pH, oxygenation, temperature, and osmolarity [10]. To maintain a physiological pH one has to control the CO2 concentration of the medium. Cells grow well in medium containing 10% fetal bovine serum and 5% CO2 environment. Special incubation chambers can be used that provide 5% CO2 concentration thanks to a pressure regulator. Another less expensive but often less efficient for long-term studies (>12h) solution is the HEPES buffer. The medium is buffered at pH 7.4 with HEPES and cells proliferate and can be kept alive at least for short-term experiments. Oxygenation is maintained for longer-term experiments by either changing the media often or using a larger volume of media initially. Osmolarity is kept near 300mosM and is maintained by the prevention of evaporation via a sealed chamber or the use of a humidified environment. To ensure that the air is humidified, the CO2 gas is bubbled through a water reservoir. The maintenance of optimal cell temperature is critical because fluctuations of just a few degrees can disrupt cellular physiology [10]. Temperature can be controlled by either using stage-top incubation chambers to heat the sample or large incubators locally to heat the whole microscope [11]. The stage top chambers fit in the XY stage or piezo insert of the microscope. They are connected to the Temperature and CO2 controller and create the appropriate environment for imaging health live cells. The objective should also be heated because it can act as a heat sink. Objective heater options include a metal foil blanket, copper tubing water jackets, and closed loop heaters. Temperature is also maintained by having an adequate volume of media in the cell chamber which serves as a thermal mass to reduce temperature fluctuations.
For better long-term temperature stability large boxes that enclose the specimen, stage, objective and part or the whole microscope body are preferred. They offer a better thermal equilibration, prevent temperature gradients and keep all parts of the scope at a common temperature, something that reduces mechanical drifts of the stage during acquisition. They often need to be custom-designed to fit around the microscope components. If at a later time new components are added to the microscope (e.g., cameras) the boxes should be adapted appropriately. They often take a long time to stabilize (several hours), they are more expensive and sometimes they can limit the direct access to all microscope components.
The cell chamber during imaging must provide conditions that keep the cells functioning and allow observation with the microscope objective. Most often live cells are viewed with an inverted microscope and are grown on glass coverslips. Like for fixed cell imaging, most of the coverslips should be type No 1.5 (0.17 mm thickness), which is the thickness for which most objectives are corrected to minimize spherical aberrations.
Various types of imaging chambers exist, from the simplest sealed coverslip on a microscope slide to perfusion chambers that enable control of the environment variables. They should all allow observation of the living samples with minimal invasion. They should be easily sterilized and isolated from the environment with a cover or seal during the observation, to avoid contamination. Sometimes it is also required that they offer access to the cells for the addition of reagents, changes of the medium or microinjections.
For short term imaging experiments (30 minutes or less), cells can perform well with just a coverslip over a spacer that is sealed with a sealant to prevent drying. Other coverslips or thin rubber slices are often used as spacers for this type of cell chamber. Sealant options include molten agarose, vacuum grease, or VALAP (1:1:1 mixture of Vaseline, lanolin, paraffin) which eliminate evaporation and restrict gas exchange.
| Cell Health Parameter | Short-Term Study | Longer-Term Study |
|---|---|---|
| pH | HEPES Buffer | CO2 Incubator |
| Temperature | Stage Warmers | Objective Lens Warmers Cell chambers with integrated heating elements Enclose microscope within a heated box |
| Humidity | Open cell chambers | Tightly sealed cell chambers |
| Oxygenation | Large volume of media | Media changes during study Large media volume |
| Osmolarity | Sealed chamber | Enclose system within a humidified chamber |
For longer-term imaging, cell chambers with more advanced features are necessary. Open cell chambers are similar to Petri dishes in that they provide access to the atmosphere. These chambers allow access to the cells and thereby allow the researcher to add drugs, change the media, or perform microinjections. Closed cell chambers are sealed to prevent evaporation of the culture media and to insulate the cells from the outside environment. These may include a port that allows the addition of drug treatment. Simple sealed cell chambers include tissue culture plates that have a hole in the bottom where a coverslip may be placed, or microscope slides with small chambers sealed into the glass. Several commercial solutions exist either in a 35 mm round dish (MatTek) [12] or in a rectangular format (LabTek) [13] or in a multiple well format such as glass bottom chamber slides from ibidi (80286) [14] or Automation 96-well glass bottom black plates from Brooks [15]. Greenwood DJ et al, for example, seeded differentiated macrophages on gridded MatTek dishes (P35G-2-14-CGRD) for live-cell imaging [16]. Glass bottom dishes can also be self-made by drilling a hole in the plastic culture dish and gluing the glass cover slide on the bottom.
These chambers are simple to use but are not tightly sealed. One way to seal is spreading some silicon grease around the inner edge of the lid before closing the dish. An alternative is to spread a layer of mineral oil on the top of the culture and observation medium.
For cell-imaging experiments that require more precise environmental control, sealed closed chambers are recommended. The choice of the imaging chamber then is strongly related to the specimen and the duration of the experiment and should be coupled with the appropriate heating system of the specimen.
Commonly used chambers include 35 mm imaging µ-dishes with polymer coverslip bottom from Ibidi [17, 18].
System attributes that provide optimal imaging conditions without affecting a lot the cell health are essential for live cell imaging. The filters of the excitation and emission light should be optimized to match the fluorophore, excite efficiently and detect the maximum of the emitted light. The use of fast mechanical shutters is essential for controlling the excitation light. For faster solutions, the shutters are triggered by the hardware (TTL trigger by the camera for example). Nowadays some excitation sources (LEDs and some lasers) can be switched on and off rapidly without the use of shutters.
For live imaging, motorized stages are recommended, that allow parallel acquisition of multiple regions of the specimen. Due to temperature gradients and stage stability, mechanical drift can appear during the experiments. To limit the focus drift, there are focus correction strategies, based either on software solutions (named autofocus) or on hardware, like the reflection of a laser on the cover slide. The latter is more efficient and should be preferred for the long term and multi-position acquisitions.
The detection system must be sensitive enough to obtain images from weakly fluorescent samples while acquiring a high signal level above any background noise or auto-fluorescence present in the sample. Cooled detectors are preferred to limit the readout noise. The detector must be fast enough to capture dynamic processes. The camera must possess enough resolution capacity to allow the capture of very fine details. The detection system must also provide a wide dynamic range to measure tiny differences in intensity accurately. The choice of the detector depends strongly on the needs of the experiment. For instance, for live cells with weak signals, EM-CCD is commonly used (back-thinned EM-CCD sensors are characterized by a high quantum efficiency that can be close to 95%). However, for fast live imaging, with a high spatial resolution, sCMOS cameras are preferred, because most often the pixel size of the chip of an sCMOS camera is around 6.5 μm when for EM-CCD the pixel size is commonly 16 μm. Significant progress is being carried out on sCMOS detectors, either by increasing their quantum efficiency with back-illuminated solutions or by lowering their noise level to crease the S/N ratio finally.
When performing live cell imaging, one should pay great attention to the illumination quantity that cells will receive and try always to minimize it to keep cells healthy and avoid phototoxicity [19]. Most cells and tissues do not usually encounter light exposure, and UV light is known to cause DNA damage. Following the excitation of fluorescent proteins or dye molecules, free radicals are formed and interact with surrounding cellular components. Efficient microscope design can minimize the detrimental effects of illumination. Microscopes should reduce the amount of excitation light used by having an optimal light path through the scope, and they should also utilize detectors optimized to detect the majority of the fluorescence emission. Within the parameters of individual experiments, illumination can be minimized by using the lowest concentration of a fluorescent probe that is needed to detect a signal. Phenol red-free medium can also help by reducing the background and exciting less (phenol red has a high visible light absorption extinction coefficient).
However, implementation of all of these techniques to minimize illumination is still not enough to completely prevent all light-induced disruptions, so controls should be performed with every experiment to ensure that cellular function has not been adversely affected by the imaging process.
The use of fluorescent probes has tremendously advanced the observation of cellular structures and processes. An ideal fluorescent probe should have well-separated absorption and emission spectra, a not too large emission spectrum (to avoid overlap), a quantum efficiency near unity (with the absence of nonradiative de-excitation processes), a large extinction coefficient (to avoid high excitation powers) and a perfect photostability. An in-depth description of the physical properties of fluorophores is beyond the scope of this article and can be found here [20-22].
For live cell imaging, the fluorescent probes should also penetrate in the cell without causing damage. Probe entry mechanisms include esterification of dyes to promote their cellular uptake, the use of synthetic vesicles containing probe [23], and mechanical techniques such as microinjection and electroporation.
The discovery of the naturally occurring green fluorescent protein (GFP), which was first isolated from jellyfish, revolutionized live cell imaging. It emits green fluorescence light under blue light excitation. It was discovered by Osamu Shimomura, in 1962, who purified it from the Aequorea victoria jellyfish [24]. It was only in 1992 that Douglas Prasher cloned the sequence of GFP and Martin Chalfie expressed this sequence in vivo [24]. Later on, the group of Roger Tsien reported the first crystal structure of GFP, showing the way for the creation of GFP mutants, to finally obtain different color variants and improve the fluorescence signal and photostability [25-27]. Shimomura, Chalfie, and Tsien were awarded in 2008 with the Nobel Prize in Chemistry for their work on the genetically encoded fluorescent proteins.
Mutation of the GFP gene led to the development of blue fluorescent protein (BFP) and a cyan fluorescent protein (CFP), which have altered absorption and emission properties from wild-type GFP [28]. Yellow fluorescent protein (YFP) and DsRed fluorescent protein derivatives have varied emission properties and thus allow scientists to use several fluorescent protein probes within the same cell. For example, a red fluorescent protein tdTomato transgenically expressed in neural stem and progenitor cells was used to delineate the neurogenesis in adult mouse brains [9].
The reason why GFP and fluorescent proteins (FPs) became so popular in biology is that with no external labeling, one can label cell compartments, or even whole cells, tissues or organisms, with the appropriate introduction of the FP gene in the genetic material of the cell or organism under study. For cell labeling, for example, it is sufficient to introduce in the cell nucleus a recombined gene including the FP encoding sequence combined with the sequence coding for the protein gene of interest. A mutant of the desired protein will then be expressed and will have fluorescence properties while keeping its functional properties, allowing highly specific labeling and thus analysis of the cellular structures and dynamics with imaging. Commercial expression vectors are available to label specific structures and organelles in live cells. For example, Choi JH et al used CellLight ER-RFP baculovirus from Life Technologies to label endoplasmic reticulum [29]. Vodnala SK et al monitored the autophagy flux of live T cells transduced with LC3-mcherry-eGFP constructs [30].
The FPs do not have to be expressed in tandom with the target protein. The target protein can be expressed with a peptide/protein tag, or even "spaghetti monster" tags [31], and be detected through the expression of, for example, anti-tag scFv, linked with an FP [32], or in the case of F-actin, a LifeAct peptide [33, 34].
Although convenient for intracellular bio-imaging, GFP and its derivatives lose their fluorescence properties under a continuous illumination period. Great attention should be paid to the expression levels of the FPs, that should be kept at similar levels than the ones of the endogenous proteins under study. Besides, when choosing a specific FP, one has to take into account the tendency of the FPs to aggregate and dimerize, which depends on various parameters, like temperature or cell line. The maturation time of the fluorophore should also be considered and varies between FPs. Zhao N et al discussed the three caveats of GFP: 1) long fluorophore maturation times, 2) slow GFP maturation times, 3) large, permanently attached, and dim moiety, which prevent its applications in particular areas of research, and designed an scFV against the HA tag as an alternative probe [32].
More recent developments include photoactivatable, photoconvertible or photo-switchable fluorescent proteins such as PA-GFP, mEOS or Dronpa [35]. PA-EGFP brightens 100 times with UV illumination, mEOS is switched from green to red with UV excitation and Dronpa is a reversibly switchable green FP that can repeatedly be turned ON with UV light (400nm) and rapidly photoswitched OFF with an excitation wavelength of 490 nm.
The second family of fluorescent probes are organic fluorescent molecules. They can be coupled explicitly to biomolecules (peptides, proteins, oligonucleotides) or cell compartments in two different ways: i) by covalent coupling (direct chemical reaction), ii) by an intermediate attachment with a peptide or antibody, which is specific to the biomolecule. The most common probes are organic dye molecules, which can be synthesized and are commercially available. They are widely used in routine procedures and well-established protocols [36]. Comparing to fluorescent proteins, they have a wider spectral range, greater photostability, smaller size and most often are brighter.
A big family of organic dyes are the sulfonated rhodamine derivatives, termed Alexa Fluors, which have intense emission, greater photostability, and increased water solubility than the traditional first developed rhodamine derivatives and have been commercially provided by Molecular Probes (Alexa Fluor is a registered trademark of Molecular Probes) [37]. Alexa Fluor dyes range in excitation and emission wavelengths, as indicated by their alphanumeric names [38]. There are many variants so that multiple labeling experiments can be done exclusively with these dyes. Alexa Fluor dyes are available both as reactive intermediates (maleimides, succinimidyl esters, hydrazides), and pre-conjugated to a variety of other molecules, including phalloidin, dextrin, and many secondary antibodies.
Another prominent family of stable dyes are the Cyanine, including Cy2, Cy3, Cy5, Cy7 and their derivatives, which are commercially available in reactive dye form or coupled to other molecules [39].
Labeling of proteins with organic dyes in living cells can be possible either by direct or indirect labeling. Direct labeling targets most often amine and cysteine groups. Frequently, the labels are incorporated at the N-terminus or Cys/Lys side chains of the peptide [40, 41]. Indirect labeling consists of using peptide tags or protein tags conjugated to organic fluorophores.
When using peptide tags, either the peptide tag is labeled and then attached to the protein through ligation, or it is genetically engineered onto the target protein and then are reacted with the corresponding fluorophore. This approach is useful for proteins sensitive to internal labeling or mutagenesis. As reviewed by O’Hare et al [42], some of the peptide solutions rely on enzyme-catalyzed fluorescent labeling (i.e., ACP tag [43] ), or simple chelation of fluorescent substrates (i.e., FlAsH labeling [44] ).
A typical case of peptide labeling is biotinylation by BirA, which covalently attaches biotin to lysine in a peptide tag. The peptide tag contains the biotin recognition sequence and can be ligated to the protein [45, 46]. BirA can also be expressed separately in processes like dimerization-induced quantitative BioID (DiQ-BioID) [47]. Biotin can also be purchased with reactive groups to target thiol or amine groups [48], but the specificity is lower compared to BirA.
Peptide fluorescent tags are small in size, which helps prevent the alteration of a target’s natural behavior.
The other labeling strategy is using protein tags, such as the self-labeling proteins (also called suicide enzymes) like SNAP-, CLIP-, or Halo-Tags, which can transfer a chemical group from a substrate to themselves [49-52]. Chromophores have been developed to detect protein aggregations between individual proteins and between two proteins through Halo-tag [53] and/or SNAP-tag in living cells [54, 55].
The possibility to add various fluorophores to their specific substrates opens a wide range of possible labeling. The self-labeling protein methods are very efficient to label membrane proteins fused to the self-labeling protein on their extracellular terminus and have been successfully used on G protein-coupled receptors [56, 57], tyrosine kinase receptors, ionic channels [58] or even intracellular proteins like histones [59].
Their main advantage is that they enable stable, covalent, and specific labeling of membrane receptors. However, potential background fluorescence and unspecific sticking of hydrophobic fluorogenic molecules to cell membranes may limit the usefulness of these systems for live cell imaging.

MitoTracker and MitoFluor target mitochondria and are trapped in the organelles after chemical modification (oxidation) [60]. Figure 1 provides an example of MitoTracker staining of a muscle cell line [1]. Herb M et al stained mitochondria in cultured peritoneal macrophages with mitochondrial membrane potential-sensitive dye MitoTracker Red CMXRos from Thermo Fisher Scientific [61], so did L Schaupp et al for dentritic cells [62]. LysoTracker [63] and LysoSensor probes target lysosomes, and BODIPY derivatives are commonly used to mark the Golgi apparatus. A turn-on ESIPT probe has been identified for the detection of homocysteine and cysteine in water with live cell-imaging [64] and so has a fluorescent sensor for lead and aluminum [65] and for fluoride [66].
The domain of organelle-specific dyes is under constant development, with probes even brighter, smaller and more specific. For instance, the Nile-Red lipid droplet marker that is widely used until now could be soon replaced by the recently developed StatoMerocyanines (SMCy) probes, which present narrow absorption and emission spectra. They are based on an indolenine moiety and a dioxaborine barbiturate derivative. They fluoresce from yellow to the near-infrared and display remarkably high molar extinction coefficients (up to 390 000 M-1 cm-1) and high quantum yield values (near to 1). All the members of this new family specifically stain the lipid droplets in live cells and tissues with very low background noise as recently shown [67].
Fluorescent probes designed to interact with inorganic ions, metals, thiols, and sulfides are also well utilized in live cell imaging. These probes, known as spectrally sensitive indicators, bind a target ion with specificity, which causes a change in their fluorescent properties. Many indicator probes, such as Ca2+ sensors, like Fluo-4 AM [68], fura-2, indo-1, and rhod-2 [69, 70] or Oregon Green 488 BAPTA-1 AM from Life Technologies [71], Cal-520-AM from AAT Bioquest [72], have been developed to interact with calcium and can measure both localized calcium concentrations within cell compartments, and quantitative changes during calcium flux in the cytoplasm [73].
Magnesium, sodium, potassium, and zinc are some other ions are that can be measured with specific fluorescent indicators. Cyclic AMP can be measured through cAMPr [74].
During the past 20 years new inorganic fluorescent probes have been proposed, as alternatives to organic fluorophores, with the aim to achieve higher fluorescence yield and lower photobleaching. Inorganic fluorescent nanocrystals include semiconductor nanocrystals (also called Quantum Dots, QDs) [75], silicon nanoparticles [74], lanthanide-doped oxide nanoparticles [76] and fluorescent nanodiamonds [77, 78]. Some of the above systems are already commercialized and widely used, some others are new and under development.

The most widely used QDs are CdSe and CdTe particles (II/VI family), which are commercially available (Invitrogen, Evident Technologies, etc.). The core size of typical QDs is 2-10 nm. A shell, usually made of ZnS is necessary to stabilize the fluorescence properties. For their solubilization, the particles are further coated with various polymers, which have the necessary chemical groups for biomolecules attachment. In the end, the total size of the particles is in the range of 20-50 nm. This is one or two orders of magnitude larger than the equivalent system using a single dye molecule as the fluorophore but is still in the nanometric scale. Their fluorescence signal is brighter than the equivalent of organic dye molecules, and they present a better photostability allowing observations and tracking over an extended period. They often coupled to antibodies, proteins, or carbohydrates for fluorescent imaging applications [79, 80]. Figure 2 provides an example of quantum dot imaging [2].
QDs may appear cytotoxic on long term due to their core chemical composition, composed of cadmium, a very toxic heavy metal element [81, 82]. Little is known yet on this issue, and further investigations are necessary.
| Type | Common Application | Pro | Con |
|---|---|---|---|
| Fluorescent Proteins (FP) | Targeting probe to specific cellular compartments or to interact with particular proteins FRET | Direct in situ labeling Can be attached to a target genetically Very specific Low toxicity | Large Size Beta barrel shape may hinder molecules under study Photobleach Low signal intensity |
| Fluorescent Peptides | Similar applications as FP but utilized when size of FP may hinder study | Small size Low Toxicity | Targets Specific Interactions Often requires coupling to molecules |
| Organic Fluorophores | Can target cell structures Label mRNA sequences | Small Good for multiplexing Limited photostability Wide range of colors | Require coupling to another molecule Photobleach Hydrophobic Somewhat toxic Lower specificity |
| Indicator Probes | Indicate presence of ions and metals | Very specific | Often requires coupling to molecules |
| Quantum Dots | Long term imaging studies Real-time tracking over extended periods | Very photostable Good for multiplexing Intense signal Enable very sensitive detection | Coupling to another molecule necessary Interference |
The drawbacks of the standard fluorescent reporters include photosensitivity and autofluorescent background. Bioluminescence, which does not require an additional light stimulation, may also be effectively applied for live-cell imaging. Bioluminescence imaging may be performed by the expression of luciferases in various cell types. Noninvasive analysis of the cells expressing luciferase is often used in preclinical studies [83]. Moreover, multicellular imaging may be done using structurally different luciferins and luciferases. For example, firefly, Renilla, and Vargula hilgendorfii luciferases were used to analyze cellular responses in a mouse tumor model [84]. Besides, luciferins may be modified to enhance luminescence detection. In particular, modified luciferins, such as CycLuc1, were shown to have increased membrane permeability [85]. Also, a recently engineered subtype of the firefly enzyme was demonstrated to interact with luciferin substrate more effectively than its older analogs [86].
Another luminescent reporter, Nano-lantern, was used for imaging of cellular organelles in vivo [87]. Several color subtypes of NanoLuc-based Nano-lantern have recently been developed [88]. Besides, another new luminescent protein Antares, which is significantly brighter than Nano-lantern, produces strong photon emission and can be used in different tissues [89] and so does its derivative Antares2 [90].
Finally, a variety of cell-permeable fluorescent molecules are available that more or less specifically label intracellular organelles. The fluorophore is coupled to a targeting moiety that will localize it to the target organelle. For nuclear staining, most common probes for living cells are intercalating DNA dyes such as DAPI, Hoechst (blue) and Draq5 (far-red).
Recently, a carboxylated silicon–rhodamine (SiR) derivative of Hoechst dye (named SiR–Hoechst or SiR-DNA from Cytoskeleton Inc [13] ) has been synthesized, and found to have a much lower KD for DNA binding (8.4μM), about 1,000-fold lower than that of Hoechst 33342 for DNA, and it has no detectable affinity towards double-stranded RNA. The dye is excited at 640 nm, and its fluorescence intensity at 670nm increases about 50-fold upon DNA binding. SiR derivatives exist in equilibrium between nonfluorescent spironolactone OFF state and a fluorescent zwitterion ON state. Aggregation of SiR or unspecific binding to hydrophobic surfaces favors the OFF state. Their interaction with polar protein surfaces switches the fluorophores into the ON state. The SiR conjugated to ligands that bind to the nucleus (SiR-Hoechst) or other organelles, like actin or microtubules. Stimulated emission depletion (STED) microscopy is shown for this kind of probes [91, 92], of which the photodamage on live cells have been evaluated [93]. Wang H et al observed the protection of target-bound dCas9-gRNA complex in the cellular environment and designed CRISPR LiveFISH procedure to label DNA and RNA in cells in real time [94]. Hafner AS used STED microscopy to observe vGLUT1+ sorted synaptosomes to study the local protein synthesis in neuronal pre- and postsynaptic compartments [95].
On a side note, probes such as To-Pro-3 [70, 96] can be used to assess/counterstain dead or fixed cells.
Light microscopy is at the heart of live cell imaging. Light microscopy requires light sources, a microscope objective (most often on a microscope stand) and a detector (camera or point detector). Many different systems have been employed. Gaglia G et al, for example, took time-lapse images of cultured cells under treatments with GE IN Cell Analyzer 6000, Perkin-Elmer Operetta High-Content Imaging System or Nikon Eclipse Ti Live-Cell Imaging System [15]. Multi-mode readers such as Cytation 5 from BioTek have been used [97].
The first applied light microscopy method was the wide field transmission microscopy. The light is passed through a condenser to focus it on the specimen to get a maximum illumination. After the light passes through the specimen, it goes through the objective lens to magnify the image of the sample and then to the occulars, where the enlarged image is viewed or to the detector. Transmission light microscopy falls into four families i) bright field, ii) dark field, iii) phase contrast (PH) and iv) differential interference contrast (DIC) microscopy.
Here the sample is not stained, and the transmitted light is detected, for example, as with Leica SP8 bright-field microscopy [98]. Setting up the light path is essential. The most used method is the Koehler illumination (August Koehler was the inventor). It employs both a field and aperture iris diaphragm to set up the illumination beam. The condenser is used to focus parallel rays on the specimen, giving the advantages of an evenly illuminated field with minimum heating of the sample. Staining can be used to enhance contrast (most common is toluidine blue, for a semi-thin section of all types of tissues).
The specimen is illuminated from the side. The scattered light from the sample is detected through the objective and is seen against a dark background, with improved contrast. A special darkfield condenser is needed to provide the oblique illumination.
Here the specimen is illuminated by a hollow cone of light passing through a phase annulus in the condenser. Special phase contrast objectives are used that have integrated a corresponding phase plate. Light passing through the sample is slightly retarded compared to rays that do not pass through, and the phase plate achieves further retardation. Destructive and constructive interferences occur of rays that combine after the objective, which produce bright and dark feature in the image. It is a widely used technique, especially for big structures (nuclei, organelles) and is under continuous development [99].
DIC microscopy requires a polarized light source and two polarizing filters, and two special Wollaston prisms that split the light into two beams. Illumination polarized light is first separated by the first prism into two beams, then passes through the sample (one beam can pass through the sample and the other next to it, thus creating a path and so a phase difference between the two beams) and is recombined by the second prism after the objective before passing through the second polarization filter and been detected. The result is a 3D-like image with shades of grey, giving the impression of al relief in the image [100].
As described previously in the review, fluorescence can be used as a label when preparing biological samples. The fluorescent molecules (fluorochromes) after excitation emit light at a different (longer) wavelength. Fluorescence microscopy employs reflected rather than transmitted light. Transmitted light techniques can very well be combined with fluorescence microscopy. Filters are necessary to visualize the fluorescence emitted. Most often a dichroic mirror cube is used that comprises the dichroic beam splitter and an excitation and emission filter. The dichroic mirror reflects shorter wavelengths and lets passes longer wavelengths of light to isolate the excitation and emission wavelengths.
A bright source is also necessary for the fluorochrome excitation. For wide field microscopy, it can be a mercury lamp, or LED sources. For confocal microscopy, monochromatic laser sources are used.
An advantage of fluorescent microscopy over bright field, dark field, and phase contrast microscopy is that different fluorescent dyes can be used simultaneously to stain different components of the cell, and can be detected simultaneously.
This is the most well-known technique of fluorescence microscopy, where the microscope forms an image of the sample on the detector (camera).
Live cells are most commonly imaged on an inverted epifluorescence microscope. In such a microscope, the objective images the sample from below. Inverted microscopes allow imaging through a glass coverslip. Cells can be grown in coverslip-bottom Petri dishes or multiwell plates containing growth media.
A significant limitation of conventional wide-field microscopy is that not only is the plane of focus illuminated, but much of the specimen above and below this point is also illuminated resulting in out-of-focus blur. This leads to a reduction of contrast and resolution, especially for thick samples, where the effect is more dominant.
For samples that are not too thick and not too densely labeled with fluorophores, this out of focus light is not a significant problem. However, for thick, densely stained samples or in cases in which we wish to achieve well-resolved 3D images, this out-of-focus light can obscure valuable information.
Confocal microscopy suppresses the out-of-focus structures at image formation. The sample is illuminated by a focused laser beam at a single point in the focal plane, instead of a full wide-field illumination [101]. The sample is raster-scanned by using galvanometric mirrors. Light from the excited point is detected on a point detector (most often photomultiplier – PMT) after passing through a pinhole. The pinhole does not permit rays of light from out-of-focus planes to pass. The wavelength of light, the numerical aperture of the objective and the diameter of the diaphragm (wider detection pinhole reduces the confocal effect but increases the detected signal) affect the depth of the focal plane.
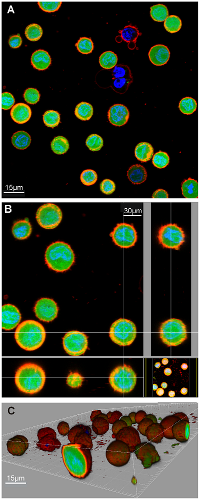
Confocal microscopes, for example, LSM 710 META laser scanning confocal microscope [18], perform optical sectioning, a process that allows the system to acquire in-focus images from several depths within a sample and then reconstruct images taken in a point-by-point manner that can be merged to create a 3D representation of a sample. Figure 3 presents an example of three color fluorescent confocal microscopy, and the 3D image generated [3].
Spinning disk multifocal confocal microscopy was developed to overcome the time-consuming point-by-point raster scanning of the confocal microscopy [102], for example, Olympus IX81 inverted spinning disc confocal microscope [14], or CV1000 automated spinning-disk microscope [103], or a Yokogawa spinning-disk confocal on a Nikon Ti inverted microscope [104]. It uses a disk of pinholes and a disk of micro-lenses from which the laser passes through. The pinhole and lens disk turn very fast (1000-10000rpm) which significantly increases the acquisition speed. The detector here is a camera, and the technique is widely used for live cell imaging. Confocal imaging provides several advantages over traditional wide-field. It shows an increased contrast and resolution and enables imaging of thicker sections, limiting the out-of-focus signal.
Advanced microscopy approaches have been developed for live cell images. They are discussed below.
Multiphoton microscopy is a type of laser-scanning microscopy that involves nonlinear excitation that elicits fluorescence in a thin plane, which improves the 3D imaging, reduces excitation of out-of-focus planes and acquires more fluorescence signal (no need of a pinhole, more scattered photons are detected) [105].
Multiphoton microscopy can image hundreds of microns deep within a section and is valuable for the study of thick sections, tissues, and even animals. Second harmonic generation (SHG) microscopy can be combined with this technique. In SHG microscopy two photons are upconverted to exactly twice the frequency of the excitation laser. SHG creation requires a noncentrosymmetric assembly, limiting the use of SHG to imaging collagen, myosin and microtubule assemblies. The main advantage though is that no labeling is needed, facilitating the imaging of these structures in live cells, tissues, and animals.
Total internal reflection fluorescence microscopy (TIRFM) selectively excites fluorophores in a specific region of a specimen that is adjacent to the glass-water interface [106]. It relies on total internal reflection of a laser beam at the interface of the coverslip and the aqueous sample. The reflected laser beam sets up an evanescent wave that penetrates in the sample only a few hundreds of nanometers (the penetration depth depends on the incident angle of the laser beam). Only fluorophores in that depth are excited and thus emit light. No background is then detected of the rest of the sample. The low background level facilitates the observation in time of single molecules [107].
This technique is well used in studies of the plasma membrane, such as studies examining the process of exocytosis or the diffusion of membrane receptors [108, 109] or chromatin dynamics [53].

Forster resonance energy transfer (FRET) microscopy was first formalized by Theodor Foerster in the middle of the twentieth century [110]. FRET strategies are based on a non-radiative resonance energy transfer between a donor and an acceptor. The efficiency of the transfer depends on the energy compatibility between the donor and the acceptor (importance of spectra overlap), the orientation of the probes (the maximum energy transfer occurs when the transition dipole moments are parallel) and the distance between the probes (energy transfer occurs only if the fluorophores are in a proximity, lower than 10nm, and the efficiency is inversely proportional to the sixth power of the distance). The technique is considered as a strong indicator of strong interactions of molecules, as energy transfer of the donor to the acceptor occurs only if the probes are in a very close distance.
Enhanced CFP and YFP proteins are often used as a FRET pair in imaging studies. The FRET phenomenon can be utilized for biosensing by engineering a donor and acceptor into a fluorescent protein (FP) that interacts with a target molecule whose conformational change is under study. When the target molecule is stimulated and its conformation changes, the donor and acceptor get close enough to cause the FRET signal. Biosensors using this approach have been developed for a wide array of molecules, including calcium [111], proteases [112], cAMP [113], and kinases [114]. See Figure 4 for an example of FRET images from [4].
The FRET analysis is either made by the intensity ratio of donor and acceptor or by calculating the change of the probes lifetimes due to the transfer by FLIM technique. FRET presents some drawbacks the direct excitation of the acceptor at the donor excitation wavelength, the emission of the donor at the emission wavelength of the acceptor, the dynamic FRET resulting from the random collision of donor and acceptor diffusing in the medium. Special care should thus be taken when planning (choice for a donor-acceptor pair), performing and analyzing FRET experiments.
Fluorescence Lifetime Imaging Microscopy (FLIM) allows visualization of the lifetime of the excitation state of a fluorescent molecule [115]. FLIM can distinguish a FRETing donor from a non-interacting donor based on lifetime excitation and can increase the signal/noise ratio of FRET [116]. With FLIM microscopy one can also measure with high precision the changes of the lifetime of the labeled proteins, changes that are directly linked to their environment.
| Techniques | Advantages | Drawbacks | Perspectives | |
|---|---|---|---|---|
| Transmission Light Microscopy | Bright-Field | Easy to use | Low contrast | Use of new equipment (detectors) and update setups to increase contrast and image smaller structures |
| Dark-Field | Improved contrast | Needs special condenser | ||
| Phase contrast | High contrast | Not efficient for all structures | ||
| DIC | Relief image | Needs specific alignment – prone to artifacts | ||
| Classic wide-field fluorescence microscopy | Epifluorescence microscopy | Easy to use Allows fast imaging | Photobleaching Detects out-of-focus signal | Combine it with other microscopy techniques |
| Confocal microscopy | Laser-scann confocal | 3D sectioning Thicker samples | Time-consuming | Faster techniques are implemented like fast-Airy scan |
| Spinning disk | 3D sectioning Thicker samples Fast imaging | Photobleaching | Improve illumination homogeneity Wider spinning disk heads and wider camera chip | |
| Advanced techniques | Multiphoton Microscopy | 3D sectioning In-depth imaging | Time-consuming Destroy sample if high power used | Faster scanning with resonant scanners or AOD solutions Use of lasers with longer wavelengths to broaden the excitation range |
| TIRF | Optical sectioning for structures near to coverslide-water interface (<200nm) | Restricted to coverslide-water interface imaging Difficult to quantify excitation | Super-critical angle fluorescence for more confined excitation | |
| FRET | Direct label with fluorescent proteins Detect direct interactions (<10nm) | Analysis artifacts linked to donor-acceptor caracteristics | Develop new donor-acceptor pairs Perform FRET with advanced microscopy methods to avoid artifacts (FLIM or spectral detection) | |
| FLIM | Measure with high precision lifetimes or proteins and influence of environment | Time-consuming | Implement new detectors for faster FLIM imaging | |
| BRET | Higher signal specificity | Needs long acquisition time per frame to collect signal – risk of detecting increased noise levels | Development of brighter luciferases | |
| FRAP | Image protein diffusion in cells | Measurement averaged over numerous fluorescent proteins | Implementation of new detectors for more sensitive monitoring of dynamics | |
| FCS | Additional information for protein dynamics in shorter times | Unable to characterize direct interactions due to diffraction limit | Combine FCS with super-resolution techniques to decrease the excitation volume | |
| SPT | Tracking of individual protein diffusion Improved localisation precision | Adapt fluorescent labeling/density | Use brighter probes to increase the signal to background ratio and thus the precision Combine SPT with PALM | |
| PALM | Study protein organisation and diffusion in dense samples | Photophysical artifacts (blinking) If not used in SPT mode, technique is slow for live imaging | Use new brighter and more stable probes | |
| Light Sheet Microscopy | Isotropic 3D resolution Low background Adapted for thick sample live imaging | Illumination artifacts artifacts for obtaining the 3D final image through fusion | New excitation modes proposed New algorithms and methods for more efficient fusion | |
BRET similarly to FRET relies on a transfer of energy, the donor probe being replaced by a complex formed by a bioluminescent enzyme, usually Renilla luciferase (Rluc), and its substrate coelenterazine (clz). Donor excitation is achieved with a chemical substrate instead of light excitation, therefore preventing any undue excitation of the acceptor.
The first BRET donor was the complex Rluc/clz (emission peak at 480 nm), and YFP was the acceptor (emission peak at 525 nm) [117]. Because of the significant overlap of Rluc and YFP emission spectra, BRET intensity is determined by calculating the BRET ratio, a mathematical calculation allowing the subtraction of donor emission at the acceptor wavelength [118]. Optimization of the enzyme/substrate complexes and use of new acceptors to reduce emission spectral overlap have been carried out, and variants of BRET have been implemented [119, 120]. Recently the smaller luciferase (Nluc) and the Antares2, described being much brighter than Rluc8 has proven to significantly enhance the resolution of BRET imaging [90, 121].
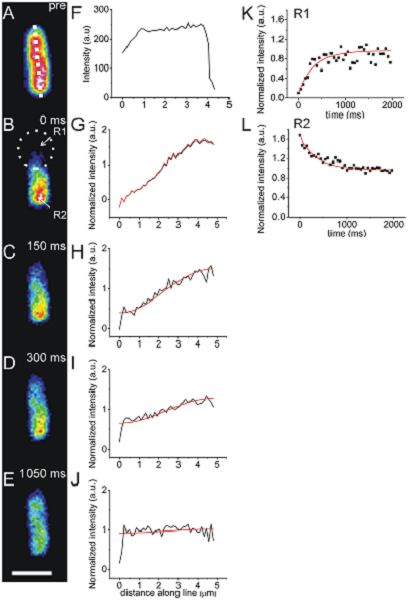
Live cell imaging is often used to observe the movement of molecules within cells. Several microscopy techniques have been developed to do this. Fluorescence recovery after photobleaching (FRAP) is one such procedure [17, 18]. With FRAP, a subcellular region is photobleached by exposing it to high intensities of light and the fluorescence recovery is monitored over time. This happens at different rates and with varied completion depending on the amount of diffusion or active transport of the fluorescent molecules into the bleached area [122]. Zhao N et al used FRAP to evaluate the binding kinetics of HA epitopes with a cognate scFv inside living cells [32]. An example of conventional FRAP is presented in Figure 5 [5]. Another application of FRAP is to study the movements of molecules through gap junctions [123]. Fluorescence loss in photobleaching (FLIP), is similar, but an area is continuously photobleached [124].
Fluorescence correlation spectroscopy (FSC) is used to gather information about the diffusion rate and concentration of target molecules by measuring the fluorescence fluctuation in a small volume for short periods [125].
Single-molecule tracking (SPT) identifies fluorescence spots corresponding to single fluorophores, pinpoints their localization with high precision and follows their diffusion in time [126]. It is lately widely used to study dynamics of proteins, like motor proteins like kinesin and dynein [127] the spatiotemporal dynamics and cytoplasmic assembly of the 26S proteasome [128] or dynamics of GPCR receptors [109].
However, if SPT allows an increase in spatial resolution, as the single fluorophore can be pinpointed to the center of mass of its diffraction-limited spot, the resolution achieved in these experiments is not higher than 20–30 nm, a value depending on fluorescence intensity, receptor density, and temporal resolution.
New techniques have recently been adapted to overcome receptor density, such as photo-activation light microscopy (PALM), using photoactivatable fluorophores. PALM is based on the photoactivation or photoswitching and subsequent bleaching of sparse fluorescent proteins in the sample, thus separating the molecules temporally and distinguishing them in space (localization procedure similar to the one for SPT) [129]. sptPALM is similar to the SPT method without the limit of protein density. It is often combined with TIRF, to increase the signal to background ratio and thus increase the localization precision. PALM is a handy tool for studying protein organization in dense samples. However, potential photophysical artifacts can influence the results. For example, blinking molecules, which can be counted more than one time and consequently be interpreted as a cluster, are a common issue for this technique. Performing control experiments is of crucial importance for quantitative PALM measurements.
For live imaging of thicker samples, new microscopy approaches exist, such as Light Sheet Microscopy. The sample is illuminated from a plane orthogonal to the imaging plane, eliminating the out-of-focus light as only light from the focal plane is excited. Thanks to the selective illumination of the plane, the total light exposure is reduced, and so are the photobleaching and phototoxicity. The sample can rotate to perform whole sample illumination, and a fusion process is carried out at the end of the acquisition for a 3D image of the sample with an isotropic resolution [130]. Double illumination schemas exist to increase speed and avoid illumination artifacts. The technique has been recently coupled to super-resolution microscopy to offer fast and super-resolved imaging of living cells [131]. Serra D et al custom-developed a light sheet microscopy to image the development of intestinal organoids [132].
Image analysis is critical to each microscopy technique described above and is well reviewed here [133]. The primary goal of image processing is to convert the image into useful information. This focuses on three aspects: reducing background noise, enhancing contrast, and quantifying the intensity of a signal. Many software programs designed to analyze and annotate the image data are available, and many of them are open source [134, 135], for example, ImageJ and Icy [18]. Advanced algorithms for image processing and data analysis are available and are quite specific to the type of image and sample being studied. While optimizing image quality and resolution during image analysis, it is important to remember that there are ethical guidelines for manipulating digital images responsibly, so that they continue to reflect the raw information embedded within them [136].
Jennifer Walker-Daniels wrote the article in 2012, and Orestis Faklaris made significant revision in 2018.
- Thal D, Schultz C, Botez G, Del Tredici K, Mrak R, Griffin W, et al. The impact of argyrophilic grain disease on the development of dementia and its relationship to concurrent Alzheimer's disease-related pathology. Neuropathol Appl Neurobiol. 2005;31:270-9 pubmed
- Lowndes R, Hallett M. A versatile light microscope heating stage for biological temperatures. J Microsc. 1986;142:371-4 pubmed
- Hanson G, Hanson B. Fluorescent probes for cellular assays. Comb Chem High Throughput Screen. 2008;11:505-13 pubmed
- Prasher D, Eckenrode V, Ward W, Prendergast F, Cormier M. Primary structure of the Aequorea victoria green-fluorescent protein. Gene. 1992;111:229-33 pubmed
- Ormo M, Cubitt A, Kallio K, Gross L, Tsien R, Remington S. Crystal structure of the Aequorea victoria green fluorescent protein. Science. 1996;273:1392-5 pubmed
- Zhang J, Campbell R, Ting A, Tsien R. Creating new fluorescent probes for cell biology. Nat Rev Mol Cell Biol. 2002;3:906-18 pubmed
- Shaner N, Steinbach P, Tsien R. A guide to choosing fluorescent proteins. Nat Methods. 2005;2:905-9 pubmed
- Heim R, Prasher D, Tsien R. Wavelength mutations and posttranslational autoxidation of green fluorescent protein. Proc Natl Acad Sci U S A. 1994;91:12501-4 pubmed
- Lippincott Schwartz J, Patterson G. Fluorescent proteins for photoactivation experiments. Methods Cell Biol. 2008;85:45-61 pubmed
- W.T. Mason. Fluorescent and luminescent probes for biological activity. Academic Press, London, 2nd ed edition, 1999.
- Panchuk Voloshina N, Bishop Stewart J, Bhalgat M, Millard P, Mao F, Leung W, et al. Alexa dyes, a series of new fluorescent dyes that yield exceptionally bright, photostable conjugates. J Histochem Cytochem. 1999;47:1179-88 pubmed
- HAINAUX H. [A REFORM OF A REFORM]. Concours Med. 1963;85:4907-11 pubmed
- Ballou B, Fisher G, Waggoner A, Farkas D, Reiland J, Jaffe R, et al. Tumor labeling in vivo using cyanine-conjugated monoclonal antibodies. Cancer Immunol Immunother. 1995;41:257-63 pubmed
- Galletto R, Amitani I, Baskin R, Kowalczykowski S. Direct observation of individual RecA filaments assembling on single DNA molecules. Nature. 2006;443:875-8 pubmed
- O Hare H, Johnsson K, Gautier A. Chemical probes shed light on protein function. Curr Opin Struct Biol. 2007;17:488-94 pubmed
- George N, Pick H, Vogel H, Johnsson N, Johnsson K. Specific labeling of cell surface proteins with chemically diverse compounds. J Am Chem Soc. 2004;126:8896-7 pubmed
- Griffin B, Adams S, Tsien R. Specific covalent labeling of recombinant protein molecules inside live cells. Science. 1998;281:269-72 pubmed
- Chen I, Howarth M, Lin W, Ting A. Site-specific labeling of cell surface proteins with biophysical probes using biotin ligase. Nat Methods. 2005;2:99-104 pubmed
- Juillerat A, Gronemeyer T, Keppler A, Gendreizig S, Pick H, Vogel H, et al. Directed evolution of O6-alkylguanine-DNA alkyltransferase for efficient labeling of fusion proteins with small molecules in vivo. Chem Biol. 2003;10:313-7 pubmed
- Juillerat A, Heinis C, Sielaff I, Barnikow J, Jaccard H, Kunz B, et al. Engineering substrate specificity of O6-alkylguanine-DNA alkyltransferase for specific protein labeling in living cells. Chembiochem. 2005;6:1263-9 pubmed
- Keppler A, Gendreizig S, Gronemeyer T, Pick H, Vogel H, Johnsson K. A general method for the covalent labeling of fusion proteins with small molecules in vivo. Nat Biotechnol. 2003;21:86-9 pubmed
- Gronemeyer T, Chidley C, Juillerat A, Heinis C, Johnsson K. Directed evolution of O6-alkylguanine-DNA alkyltransferase for applications in protein labeling. Protein Eng Des Sel. 2006;19:309-16 pubmed
- Meyer B, Segura J, Martinez K, Hovius R, George N, Johnsson K, et al. FRET imaging reveals that functional neurokinin-1 receptors are monomeric and reside in membrane microdomains of live cells. Proc Natl Acad Sci U S A. 2006;103:2138-43 pubmed
- Keij J, BELL PRINCE C, Steinkamp J. Staining of mitochondrial membranes with 10-nonyl acridine orange, MitoFluor Green, and MitoTracker Green is affected by mitochondrial membrane potential altering drugs. Cytometry. 2000;39:203-10 pubmed
- Goswamia S et al A colorimetric and ratiometric fluorescent turn-on fluoride chemodosimeter and application in live cell imaging: high selectivity via specific Si-O cleavage in semi-aqueous media and prompt recovery of ESIPT along with the X-ray structures. Tetrahedron Letters. 2014;55:2633–2638.
- Helm P, Patwardhan A, Manders E. A study of the precision of confocal, ratiometric, Fura-2-based [Ca2+] measurements. Cell Calcium. 1997;22:287-98 pubmed
- Warner J, Hoshino A, Yamamoto K, Tilley R. Water-soluble photoluminescent silicon quantum dots. Angew Chem Int Ed Engl. 2005;44:4550-4 pubmed
- Alivisatos P. The use of nanocrystals in biological detection. Nat Biotechnol. 2004;22:47-52 pubmed
- E. Beaurepaire, V. Buissette, M.-P. Sauviat, D. Giaume, K. Lahlil, A. Mercuri, D. Casanova, A. Huignard, J.-L. Martin, T. Gacoin, J.-P. Boilot, and A. Alexandrou. Functionalized Fluorescent Oxide Nanoparticles: Artificial Toxins for Sodium Channel Targeting and Imaging at the Single- Molecule Level. Nano Lett., 4:2079–2083, 2004. Available from: dx.doi.org/10.1021/nl049105g
- Dahan M, Levi S, Luccardini C, Rostaing P, Riveau B, Triller A. Diffusion dynamics of glycine receptors revealed by single-quantum dot tracking. Science. 2003;302:442-5 pubmed
- Kirchner C, Liedl T, Kudera S, Pellegrino T, Munoz Javier A, Gaub H, et al. Cytotoxicity of colloidal CdSe and CdSe/ZnS nanoparticles. Nano Lett. 2005;5:331-8 pubmed
- Bink K, Walch A, Feuchtinger A, Eisenmann H, Hutzler P, Hofler H, et al. TO-PRO-3 is an optimal fluorescent dye for nuclear counterstaining in dual-colour FISH on paraffin sections. Histochem Cell Biol. 2001;115:293-9 pubmed
- Allen R, David G, Nomarski G. The zeiss-Nomarski differential interference equipment for transmitted-light microscopy. Z Wiss Mikrosk. 1969;69:193-221 pubmed
- Paddock S. Confocal laser scanning microscopy. Biotechniques. 1999;27:992-6, 998-1002, 1004 pubmed
- Denk W, Strickler J, Webb W. Two-photon laser scanning fluorescence microscopy. Science. 1990;248:73-6 pubmed
- Foerster T (1948) Zwischenmolekulare Energiewanderung und Fluoreszenz. Annalen des Physik (Leipzig) 2:55–75.
- Nakai J, Ohkura M, Imoto K. A high signal-to-noise Ca(2+) probe composed of a single green fluorescent protein. Nat Biotechnol. 2001;19:137-41 pubmed
- Mahajan N, Harrison Shostak D, Michaux J, Herman B. Novel mutant green fluorescent protein protease substrates reveal the activation of specific caspases during apoptosis. Chem Biol. 1999;6:401-9 pubmed
- DiPilato L, Cheng X, Zhang J. Fluorescent indicators of cAMP and Epac activation reveal differential dynamics of cAMP signaling within discrete subcellular compartments. Proc Natl Acad Sci U S A. 2004;101:16513-8 pubmed
- Ting A, Kain K, Klemke R, Tsien R. Genetically encoded fluorescent reporters of protein tyrosine kinase activities in living cells. Proc Natl Acad Sci U S A. 2001;98:15003-8 pubmed
- Wallrabe H, Periasamy A. Imaging protein molecules using FRET and FLIM microscopy. Curr Opin Biotechnol. 2005;16:19-27 pubmed
- Pelet S, Previte M, So P. Comparing the quantification of Forster resonance energy transfer measurement accuracies based on intensity, spectral, and lifetime imaging. J Biomed Opt. 2006;11:34017 pubmed
- Pfleger K, Eidne K. Illuminating insights into protein-protein interactions using bioluminescence resonance energy transfer (BRET). Nat Methods. 2006;3:165-74 pubmed
- Pfleger K, Seeber R, Eidne K. Bioluminescence resonance energy transfer (BRET) for the real-time detection of protein-protein interactions. Nat Protoc. 2006;1:337-45 pubmed
- Reits E, Neefjes J. From fixed to FRAP: measuring protein mobility and activity in living cells. Nat Cell Biol. 2001;3:E145-7 pubmed
- Xie H, Laird D, Chang T, Hu V. A mitosis-specific phosphorylation of the gap junction protein connexin43 in human vascular cells: biochemical characterization and localization. J Cell Biol. 1997;137:203-10 pubmed
- Köster M, Frahm T, Hauser H. Nucleocytoplasmic shuttling revealed by FRAP and FLIP technologies. Curr Opin Biotechnol. 2005;16:28-34 pubmed
- Van Craenenbroeck E, Engelborghs Y. Fluorescence correlation spectroscopy: molecular recognition at the single molecule level. J Mol Recognit. 2000;13:93-100 pubmed
- Kural C, Kim H, Syed S, Goshima G, Gelfand V, Selvin P. Kinesin and dynein move a peroxisome in vivo: a tug-of-war or coordinated movement?. Science. 2005;308:1469-72 pubmed
- Betzig E, Patterson G, Sougrat R, Lindwasser O, Olenych S, Bonifacino J, et al. Imaging intracellular fluorescent proteins at nanometer resolution. Science. 2006;313:1642-5 pubmed
- Collins T. ImageJ for microscopy. Biotechniques. 2007;43:25-30 pubmed
- Yoo T, Ackerman M, Lorensen W, Schroeder W, Chalana V, Aylward S, et al. Engineering and algorithm design for an image processing Api: a technical report on ITK--the Insight Toolkit. Stud Health Technol Inform. 2002;85:586-92 pubmed
- Materials and Methods [ISSN : 2329-5139] is a unique online journal with regularly updated review articles on laboratory materials and methods. If you are interested in contributing a manuscript or suggesting a topic, please leave us feedback.
- product