This article reports a survey of flow cytometers cited in the literature, and also introduces the basics for flow cytometry.
Flow cytometry is used to measure and analyze multiple physical characteristics of individual cells and other particles within heterogeneous suspensions. Most cytometers can detect cells between 1 and 15 microns in diameter, although it is possible to detect particles outside of this range (0.2 -150 microns) using specialized systems [1]. Flow cytometers are used for a wide range of applications including: GFP expression analysis [2, 3], ploidy analysis [4, 5], immunophenotyping [6, 7], cancer diagnosis [8, 9], cell sorting [10, 11], and cell counting [12], or combined with imaging techniques, termed Imaging Flow Cytometry [13]. Table 1 enumerates some of its common applications.
| Field of Study/Research | Application | References |
|---|---|---|
| Immunophenotyping | Cancer diagnosis/monitoring | [14] |
| Monitoring HIV/AIDS progression | [15] | |
| Drug Discovery | Drug resistance/uptake | [1, 8, 16] |
| DNA Analysis | Ploidy analysis | [4, 5] |
| Chromosome analysis and sorting | [4, 10, 11] | |
| Sex preselection | [17] | |
| Transgenic products in vivo | GFP expression analysis | [2, 3] |
| Microbiology | Microbial identification | [1, 18, 19] |
| Bacterial viability | [20, 21] |
Flow cytometric analysis is accomplished by moving thousands of cells (per second) through a laser beam and then capturing the light that emerges after each pass. Specialized software analyzes the data gathered to discover cellular properties such as size, internal complexity, phenotype, and health. This capability - measuring several parameters of tens of thousands of single cells in a matter of minutes - is the true power of flow cytometry.
A flow cytometer consists of four basic components: fluidic system, laser(s), optics, and electronics/external computer system (Figure 1). Additionally, a sorting device can be added to collect cells after they have run past the laser.

Briefly, the cells are loaded onto the collection stage of the flow cytometer. The sample is drawn up into the fluidic system and pumped to the flow chamber, or flow cell. The cells are combined with a stream of sheath fluid which quickly moves them, one at a time, past one or more light sources (commonly lasers). The beam of light from the laser shines/excites the cells as they pass through the flow chamber. Light scattering and/or fluorescence (depending on if fluorochromes are present on the cell) are captured, filtered spectrally, and converted to electrical signals (voltage) through photodetectors. An external computer system then digitizes the voltage data. The digital information is analyzed to quantitate the characteristics of the cells.
The flow chamber, as the core of the flow cytometer, transports particles (cells and/or microbes) to the laser. The interrogation point where the laser intersects with the sample, is also the place the optics system detects light scatter and fluorescence. The fluidic system of a flow cytometer is designed to deliver cells in an orderly single file stream to the interrogation point so that only one cell passes through at a time, through a process called hydrodynamic focusing (Figure 2).

Operating on principles relating to laminar flow, the sample is injected into the center of a stream of sheath fluid. The sample pressure is always greater than the sheath fluid pressure. The sample flow rate is controlled by adjusting the sample pressure relative to the sheath pressure using a pressure regulator. Flow rate is increased by increasing the sample pressure, which widens the sample core so that more cells pass through the interrogation point at one time. Conversely, lowering the sample pressure decreases the flow rate by compressing the sample core, thereby allowing fewer cells to pass through the laser beam at one time (Figure 3). A wider sample core can result in some cells passing through the laser slightly off-center and therefore intercept the beam at a less than optimal angle. Generally, higher flow rates mean lower resolution and best used for qualitative measurements (e.g., immunophenotyping) [22, 23]. Lower flow rates result in greater resolution, since most of the cells pass through the center of the laser, and are typically used in applications where higher clarity is critical (e.g., DNA analysis) [4, 24].

Hydrodynamic focusing aligns particles and cells to pass single file through the sample core before reaching the interrogation point. At that point, light is refracted or scattered in all directions. The extent that light is deflected depends largely on the physical characteristics of a particle, specifically internal complexity and size. The cell shape, surface topography, membrane, nucleus and granular material all affect the scattering of light.
Light scatter is collected at two angles: Forward Scatter (FSC) and Side Scatter (SSC). Forward scatter is a measurement of mostly diffracted light in the direction of the laser's path, or forward direction, and is proportional to cell surface area or size. Proportional to cell granularity or internal complexity, side scatter is collected at approximately 90-degrees from the laser's path and is primarily a measurement of refracted and reflected light (Figure 4).

Forward and side scatter data can be used to classify samples by size (FSC) and by internal complexity (SSC). For example, Figure 5 illustrates how plotting forward scatter data against side scatter data can reveal morphology information about a peripheral blood sample (each dot represents a cell). FSC data plotted on the x-axis allows for size distinction with smaller lymphocytes appearing to the far left, while SSC data (y-axis) makes differentiating between the comparably sized monocytes and neutrophils possible based on cell granularity. Flow cytometers are also capable of detecting fluorescence from properly labeled cells. Combining FSC, SSC, and fluorescence data allow researchers to tease out multiple subpopulations of cells from their samples.

The argon ion laser, which emits a 488 nm light, is most commonly used in cytometry because it can excite multiple fluorochromes. Various fluorochromes can be used in combination if each is excited at the same wavelength (in this case, 488 nm) and their peak emission wavelengths are not too close to each other. Two of the most widely used fluorochromes that meet these criteria are fluorescein isothiocyanate (FITC) and phycoerythrin (PE). The absorption spectra of FITC and PE peak at approximately 495 nm and are easily excited by the argon laser's 488 nm wavelength (Note: PE has a double absorption maximum and peaks at 545 nm as well). The peak emission wavelengths of FITC and PE (530 nm and 570 nm, respectively) are distant enough so that their signals can be picked up by different detectors.
Strong fluorescence signals indicate the presence of a large number of fluorochrome molecules on a cell/particle. When a fluorescent compound like fluorescein isothiocyanate or phycoerythrin is conjugated to a monoclonal antibody, it can be used to identify specific cell types due to individual surface proteins that are characteristic to those distinct cells. Therefore, in a mixed sample of cells, different fluorochromes can be used to tease out separate subpopulations. Along with FSC and SSC data, the fluorescence staining of each subpopulation help determine what types and what percentage of cells are in a sample.
Two- and three-color flow cytometric measurement is most common, however new developments in hardware (lasers and optics), fluorochromes, and software analysis tools are allowing for the possibility of multicolor (5 or greater) measurements. There are three keys to multicolor flow cytometry: 1) fluorochromes with high fluorescence intensity, easily conjugated to monoclonal antibodies, and with little spectral overlap amongst each other [25] ; 2) multiple lasers to excite different dyes and selective filters to limit wavelength overlap between detectors; 3) analysis software capable of compensating the spectral overlaps between dyes;
The optical system of a flow cytometry consists of two parts: excitation optics and collection optics. The excitation optics (lasers and lenses) focus and shape the laser beam so that it consistently intersects with the interrogation point at a fixed position. Light emitted from the particle is collected with a lens (collection lens) and passed through a system of optical mirrors (dichroic) and filters (bandpass, shortpass, or longpass) which reroute specified wavelengths of light to designated optical detectors. This process is achieved by the collection optics.
Figure 6 illustrates the path the laser beam takes after it strikes a particle or cell. Light traveling along the laser's path in the forward direction (FSC) is gathered by a collection lens and sent to a photodiode that converts the light signal into a current, which is in turn recorded by the electronics system. As mentioned above, this light is the forward scatter signal and is proportional to the size of the cell. Light is also collected at a 90-degree angle to the laser's path. This light represents the side scatter signal as well as any fluorescent emissions from excited fluorochromes. Emitted SSC and fluorescence light is gathered by a collection lens and redirected to detectors called photomultiplier tubes (PMTs). Light signals are routed to their detectors through a series of dichroic mirrors (DM) and optical filters. Because PMTs often detect weak fluorescent signals, filters are placed in front of them to optimize their capability to detect their designated color of light. These filters are fabricated to only allow a narrow range of wavelengths to pass through and correspond to the emission peaks of the fluorescent dyes being used. Filters that allow a specific spectral band of light through are called bandpass (BP) filters. For example, the filter placed in front of the FITC detector is labeled 530/30, this means that only light with a wavelength of 515 nm to 545 nm will be able to pass through.

Two other types of filters are used in flow cytometry. Shortpass (SP) filters transmit wavelengths of light equal to or shorter than a specified wavelength, and longpass (LP) filters permit wavelengths equal to or longer than a defined wavelength (Figure 7).

The mirrors used in a flow cytometer are light beam splitters and are designed to reflect certain wavelengths and let others pass through. Similar to the filters, dichroic mirrors can be either shortpass or longpass. For example, a 510LP mirror would permit wavelengths of light greater than or equal to 510 nm to pass through it while reflecting wavelengths less than 510 nm to a filter or another mirror.
In summary, the laser(s) and focusing lens of the excitation optics produce a beam of light that collides with the particle or cells at the fixed interrogation point. The light scatter produced from this cell-laser interaction is gathered by collection lenses and directed to either a photodiode (FSC) or redirected via a system of mirrors and filters (SSC and emitted fluorescence) to the appropriate photodetectors (PMTs). The detectors convert the light signals into currents, which are then sent to the electronics system.
The function of the electronics system of the flow cytometer is twofold; convert light signals into electronic signals (voltages) and perform data analysis. The former is achieved by one of the two types of photodetectors mentioned above (photodiodes and photomultiplier tubes). The photodiode is less sensitive to light and is primarily used to detect the stronger forward scatter signal. PMTs are capable of identifying much weaker signals and, therefore, are used to detect the emitted side scatter and fluorescence light.
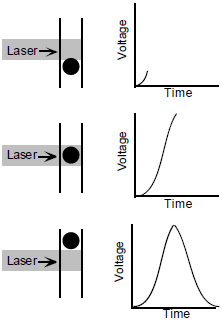
An electronic signal, or voltage pulse, is created when a particle/cell enters the path of the laser beam and starts to scatter light or fluoresce. This light then enters the photodetectors (PMT or photodiode) and is converted into electrons. The electrons are multiplied creating a larger electrical current. Next, the current is amplified and transformed into a voltage pulse. The voltage pulse starts to increase as the cell enters the path of the laser, peaks when it's at the center of the beam, and returns to baseline after it has completely past through (Figure 8).
Lastly, voltage pulses are quantified by signal processors into numerical values for pulse height, width, and area. This data is then transferred to the cytometer computer workstation for storage and further analysis.
One of the major benefits of flow cytometry is that it enables a researcher to measure several physical characteristics of each cell in a sample population. After the data is collected and transferred into a digital format, it is ready to be parsed out using the cytometers computer software. The depth of analysis completed on the data is largely determined by the goals of the researcher and can vary from simple morphology classification of a sample by plotting FSC and SSC to identifying multiple subpopulations (via gating) in a sample using various cell surface markers (fluorochromes). The most common methods of visualizing flow cytometry data are discussed below.
A histogram is a single parameter plot where the y-axis shows the number of events (cell count) and the x-axis (log or linear) depicts the parameters digital signal value. For example, Figure 9 denotes a log histogram where the horizontal axis represents the signal intensity of FITC and the vertical axis represents the number of events per channel.

A dot plot is a two-parameter graphical representation of a sample's properties where each point plotted corresponds to an individual cell. Figure 10 depicts a typical scatter plot (FSC vs. SSC) that would be used to define the size and complexity of the cells in the sample of interest.

Whether to use a linear or logarithmic scale on an axis depends mainly on the range of intensity of the fluorescence signal. Where the range is narrow using a linear scale would be best as important subtle difference could become obscured if a log scale is used. Conversely, in cases where fluorescence intensities can vary 100-fold, using linear scaling might make two distinct populations hard to visualize as the plot would look too compressed against the axis.
Subsets of data can be defined through gating. A gate is a numerical or graphical boundary used to isolate subpopulations of particles/cells in order to generate statistics on a limited number of events in a given sample.

For example, if a researcher were analyzing a sample of peripheral blood that had been stained with fluorochromes to identify the CD 4 and CD 14 surface proteins but were only interested in knowing the percentage of monocytes that contained those markers, they might place a gate around the monocyte population of the FSC vs. SSC scatter plot (Figure 11) thereby limiting the data they visualize to monocytes as compared to the entire population of cells. Next, using a dot plot to graph the gated region they would be able to gain a clearer understanding of what percentage of monocytes express only CD 4, only CD 14, neither, or both (Figure 12).

After a particle/cell passes through the laser beam it is sent to a waste aspirator. Fluorescence-activated cell sorting (FACS) is the process by which cells that have run through a flow cytometer can be captured and recollected for further analysis (i.e., microscopy, cell culture, etc.).
In order to sort cells a gate must first be placed around the population of interest during acquisition, thus ensuring the cytometer knows which cells to separate from the sample. With the sort gate in place the software is now able to identify cells in the subpopulation of interest that subsequently pass through the laser. Using a conductive sheath fluid the sample stream is vibrated as it exits the nozzle which causes it to break up into droplets of fixed size (each containing one cell). A charge is then applied to the drops containing the cells that meet the criteria established with the sorting gate. On either side of the vibrating stream are positively and negatively charged plates. As the charged droplets pass by these plates they are deflected to the collection containers, depending on the droplet's charge polarity (Figure 13). Cell sorting has significantly expanded the research and diagnostic potential of flow cytometry, as it enables subpopulations of particles/cells to be separated from heterogeneous samples with a high degree of purity.

Flow cytometer manufacturers provide software to run their machines. These programs are largely used for application setup and data acquisition. For example, Becton, Dickinson and Company includes a copy of BD FACSDiva with their cytometers, for example [26]. This software automates the cytometer setup to simplify operation. It also provides the user with an intuitive experimental interface for convenient, reproducible data acquisition. Furthermore, with the FACSDiva software, cytometer users can configure the internal optics of the machine using a visual tool that shows the layout of detectors, filters, and mirrors. Manufacturer-provided software can also be used for data analysis; however their capabilities are often limited to only basic functions.
Full-featured analyses-only software is available to cytometer users that require a higher level of analyses that manufacturer programs cannot provide. FlowJo is one of the most popular software packages for analyzing flow cytometry data on the market. Cytometers write data files in the Flow Cytometer Standard (file extension .fcs) format. Third-party programs like FlowJo import these data files so that analysis is possible regardless of which brand of flow cytometer is used for collection.
Flow cytometry uses the principles of light scatter and the excitation and emission of fluorescent molecules to gather multiparametric data from cells and particles ranging from 0.2 to 150 microns in size. Flow cytometry's greatest strength is its speed. Using a hemocytometer on a stage microscope a scientist can count approximately 250 cells in a minute. A flow cytometer can discriminate thousands of cells in seconds.
The flow cell is where samples are hydrodynamically focused into a single file stream of particles/cells. At the interrogation point the cells pass through a laser beam causing its light (and that of any fluorochromes present) to scatter in all directions. Collection lens in the forward and side (90 degrees) position redirect this scattered light toward a system of optical hardware. A network of beam splitters (mirrors) and filters reroute specific wavelengths of light to corresponding photodetectors (photodiodes and PMTs) where the signal is amplified and converted into an electrical current.
This voltage pulse is then further transformed by a computer system into a digital signal. Analysis software is applied to classify and categorize the cells based on their properties of light scatter. Subpopulations can be further examined using gates and any number of plotting options including, histograms and dot plots. To retain or purify samples, sorting equipment that recaptures and collects cells after they have passed through the laser is available.
Flow cytometry is a superior method of cell analysis but comes at a lofty price. The biggest disadvantage to using flow cytometry is lack of affordability (second would be size). Cytometers are bulky machines which range from thirty thousand (used) to three hundred thousand dollars (new), not including the cost of sheath fluid, fluorochromes, replacement parts, analysis software and all the other accoutrements required to run them. Many academic institutions and hospitals will share a handful of machines between all of their departments in order to absorb the exorbitant cost of owning and maintaining a cytometer, thereby making them available to as many researchers as possible.
| supplier | model | num | literature examples | ||
|---|---|---|---|---|---|
| ACEA Biosciences | |||||
| NovoCyte | 1 | [14] | |||
| BD Biosciences | |||||
| FACSCalibur | 67 | [27] | |||
| LSR II | 58 | [28, 29] | |||
| FACSCanto | 29 | [30, 31] | |||
| LSR Fortessa | 12 | [29, 32] | |||
| Aria II, III, Fusion | 10 | [33, 34] | |||
| Accuri | 1 | [35] | |||
| Beckman Coulter | |||||
| CytoFLEX | 1 | [35] | |||
| Gallios | 1 | [36] | |||
| Cytek Bio | |||||
| Aurora | 3 | [7, 37] | |||
| Miltenyi Biotec | |||||
| MACSQuant VYB | 1 | [38] | |||
| ThermoFisher | |||||
| Attune NxT | 3 | [39, 40] | |||
Flow cytometry technology is ever progressing. As a result, costs are coming down. Newer, cheaper diode lasers are beginning to replace the significantly more expensive gas ion lasers [25]. Also, less expensive devices using the principles of flow cytometry are being developed. In 2011, a group of researchers in UCLA designed and engineered a lightweight, compact cytometer that attaches to a cell phone and costs less than ten dollars to run. Despite high costs and the need for well-trained operators, flow cytometry still remains the first and best choice for high-speed sample analysis.
Labome conducted a survey of randomly selected formal publications citing flow cytometry. Table 2 lists all suppliers cited in the publications, and commonly or cited cytometer models or newer models. Flow cytometry software is discussed in a separate article. For example, Boettcher S et al conducted cell cycle analysis and cell apoptosis detection with a FACSCanto II from BD Biosciences [41]. Chopra S et al examined the expression of CD11C and MHC-II on mouse bone marrow–derived dendritic cells with an LSR II instrument from BD Biosciences and sorted live CD45+ cells with a BD Aria II SORP cell sorter [42]. Flaherty SE et al. analyzed mouse stromal vascular cells with a BD Biosciences Fortessa Flow Cytometer and sorted them with a BD Aria II Cell Sorter [43]. Capello M et al measured exosomes and their markers with a Gallios flow cytometer from Beckman Coulter [36].
- Davey H, Kell D. Flow cytometry and cell sorting of heterogeneous microbial populations: the importance of single-cell analyses. Microbiol Rev. 1996;60:641-96 pubmed
- Kalejta R, Shenk T, Beavis A. Use of a membrane-localized green fluorescent protein allows simultaneous identification of transfected cells and cell cycle analysis by flow cytometry. Cytometry. 1997;29:286-91 pubmed
- Sirk D, Zhu Z, Wadia J, Mills L. Flow cytometry and GFP: a novel assay for measuring the import and turnover of nuclear-encoded mitochondrial proteins in live PC12 cells. Cytometry A. 2003;56:15-22 pubmed
- Lomax B, Tang S, Separovic E, Phillips D, Hillard E, Thomson T, et al. Comparative genomic hybridization in combination with flow cytometry improves results of cytogenetic analysis of spontaneous abortions. Am J Hum Genet. 2000;66:1516-21 pubmed
- Lacombe F, Belloc F. Flow cytometry study of cell cycle, apoptosis and drug resistance in acute leukemia. Hematol Cell Ther. 1996;38:495-504 pubmed
- McCoy J, Carey J. Recent advances in flow cytometric techniques for cancer detection and prognosis. Immunol Ser. 1990;53:171-87 pubmed
- Boissière A, Arnathau C, Duperray C, Berry L, Lachaud L, Renaud F, et al. Isolation of Plasmodium falciparum by flow-cytometry: implications for single-trophozoite genotyping and parasite DNA purification for whole-genome high-throughput sequencing of archival samples. Malar J. 2012;11:163 pubmed publisher
- Barbesti S, Soldini L, Carcelain G, Guignet A, Colizzi V, Mantelli B, et al. A simplified flow cytometry method of CD4 and CD8 cell counting based on thermoresistant reagents: implications for large scale monitoring of HIV-infected patients in resource-limited settings. Cytometry B Clin Cytom. 2005;68:43-51 pubmed
- Pattanapanyasat K. Immune status monitoring of HIV/AIDS patients in resource-limited settings: a review with an emphasis on CD4+ T-lymphocyte determination. Asian Pac J Allergy Immunol. 2012;30:11-25 pubmed
- Krishan A, Fitz C, Andritsch I. Drug retention, efflux, and resistance in tumor cells. Cytometry. 1997;29:279-85 pubmed
- Johnson L, Flook J, Look M. Flow cytometry of X and Y chromosome-bearing sperm for DNA using an improved preparation method and staining with Hoechst 33342. Gamete Res. 1987;17:203-12 pubmed
- Steen H, Boye E. Escherichia coli growth studied by dual-parameter flow cytophotometry. J Bacteriol. 1981;145:1091-4 pubmed
- Allman R, Hann A, Manchee R, Lloyd D. Characterization of bacteria by multiparameter flow cytometry. J Appl Bacteriol. 1992;73:438-44 pubmed
- Shapiro H, Nebe von Caron G. Multiparameter flow cytometry of bacteria. Methods Mol Biol. 2004;263:33-44 pubmed
- Votyakova T, Kaprelyants A, Kell D. Influence of Viable Cells on the Resuscitation of Dormant Cells in Micrococcus luteus Cultures Held in an Extended Stationary Phase: the Population Effect. Appl Environ Microbiol. 1994;60:3284-91 pubmed
- Loken M, Brosnan J, Bach B, Ault K. Establishing optimal lymphocyte gates for immunophenotyping by flow cytometry. Cytometry. 1990;11:453-9 pubmed
- Gorczyca W. Acute promyelocytic leukemia: four distinct patterns by flow cytometry immunophenotyping. Pol J Pathol. 2012;63:8-17 pubmed
- Baumgarth N, Roederer M. A practical approach to multicolor flow cytometry for immunophenotyping. J Immunol Methods. 2000;243:77-97 pubmed
- Materials and Methods [ISSN : 2329-5139] is a unique online journal with regularly updated review articles on laboratory materials and methods. If you are interested in contributing a manuscript or suggesting a topic, please leave us feedback.
- method
- Antibody Applications
- Antibody Companies
- Antibody Dilution and Antibody Titer
- Antibody Quality
- Antibody Storage and Antibody Shelf Life
- Antibody Structure and Antibody Fragments
- Beta Actin Antibody
- Flow Cytometry and Cell Sorting: A Practical Guide
- GFP Antibody
- HA Hemagglutinin Tag Antibody and FAQs
- Mouse Antibody
- Myc Antibody Review
- Phosphotyrosine Antibody
- Rabbit Antibody
- Recombinant Antibodies
- Secondary Antibodies
- Software Companies
- Software Programs in Biomedical Research